Authors

Loïc Mathieu
Lead Developer
Loïc Mathieu
Lead Developer
Kestra 2.0 rebuilds the execution engine. The architecture side of that change is covered in what changed in the engine. This post covers the performance side.
Previous posts in this series were about tuning individual hot paths. 2.0 is different: it changes what the engine has to do for each execution, and the benchmarks move accordingly.
The post starts with the numbers, 1.3 against 2.0 on identical hardware, then goes through the changes that produced them, and ends with where the ceiling sits now, because it is no longer where it used to be.
We switched from e2-standard-4 to n2-standard-4 VMs for our reference benchmarks. Both versions below ran on the new VMs, so the comparison is like for like.
Description Triggered by a Webhook. Contains two tasks:
| step | rate | avg ms | p99 ms | kestra cpu | infra cpu |
|---|---|---|---|---|---|
| 1 | 1000 | 158 | 239 | 23.8% | 36.4% |
| 2 | 1500 | 171 | 377 | 32.5% | 44.7% |
| 3 | 2000 | 244 | 694 | 38.5% | 57.7% |
| 4 | 2500 | 3526 | 7624 | 42.9% | 64% |
| 5 | 3000 | 20718 | 37166 | 49.2% | 68.8% |
| 6 | 3500 | 23662 | 59735 | 46.7% | 66.2% |
| 7 | 4000 | 27490 | 58624 | 45.6% | 68% |
| 8 | 4500 | 28065 | 59210 | 24.8% | 57.4% |
| 9 | 5000 | 32219 | 59701 | 13.6% | 47.9% |
| step | rate | avg ms | p99 ms | kestra cpu | infra cpu |
|---|---|---|---|---|---|
| 1 | 1000 | 126 | 174 | 22.3% | 30.6% |
| 2 | 1500 | 121 | 169 | 26.2% | 38.7% |
| 3 | 2000 | 113 | 159 | 34.7% | 42.1% |
| 4 | 2500 | 118 | 171 | 37.1% | 51.2% |
| 5 | 3000 | 130 | 205 | 45.9% | 56.8% |
| 6 | 3500 | 148 | 297 | 48% | 58.1% |
| 7 | 4000 | 181 | 474 | 51.2% | 68.9% |
| 8 | 4500 | 1113 | 2079 | 57.9% | 68.8% |
| 9 | 5000 | 53540 | 145112 | 33.1% | 58% |
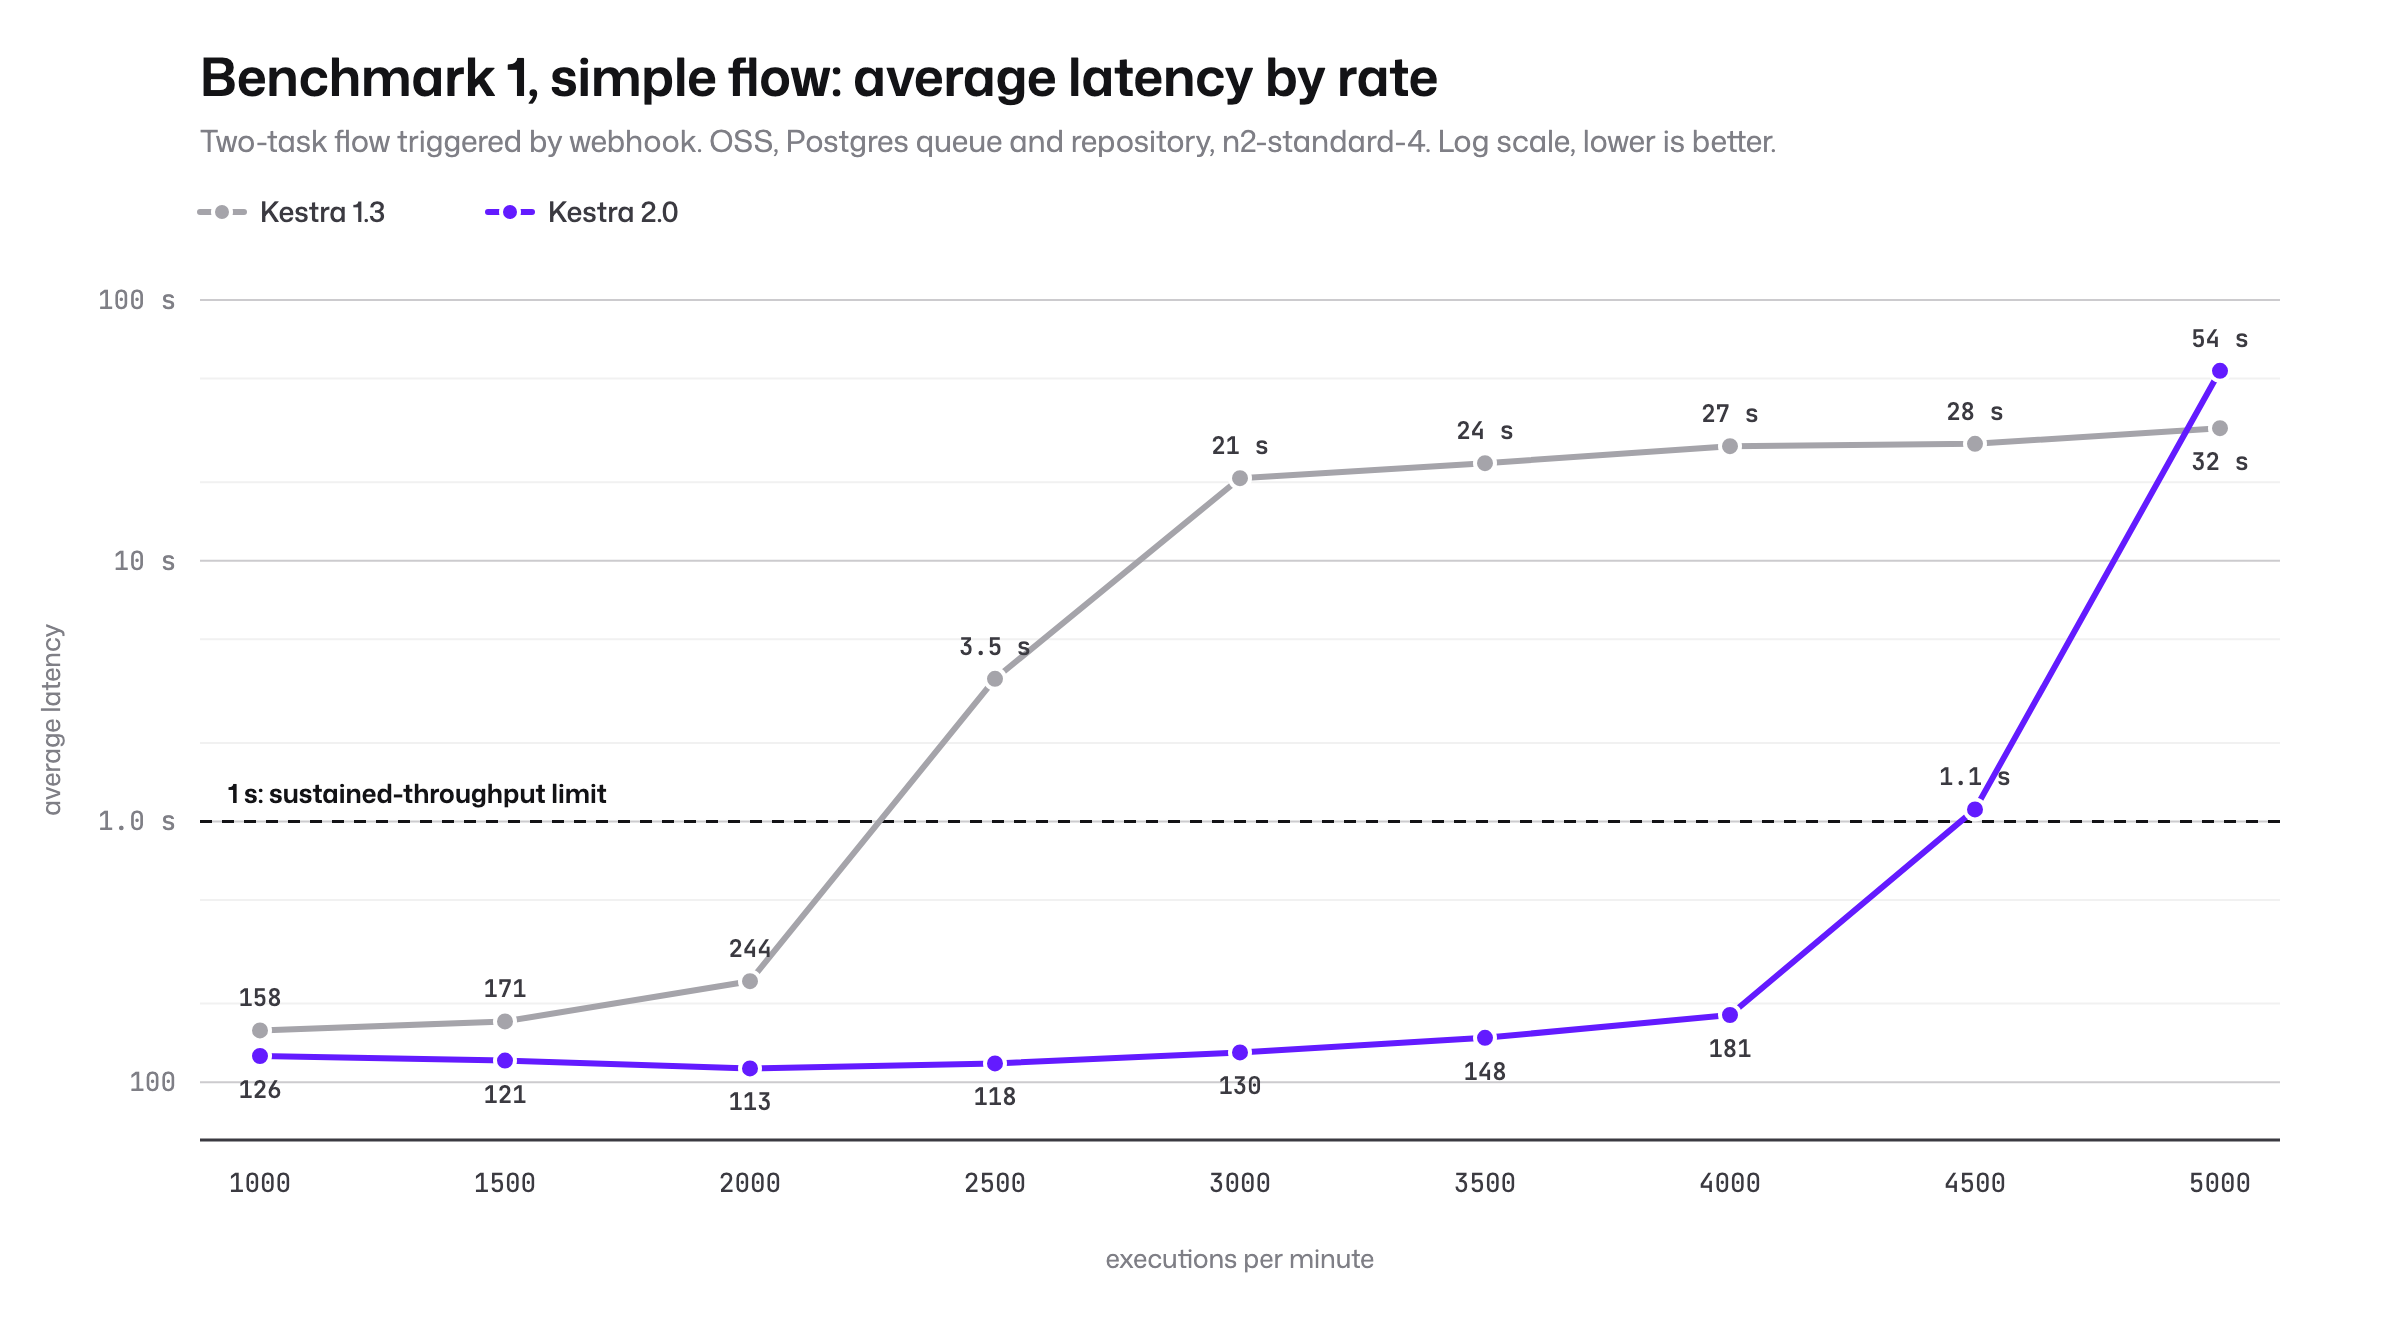
We define sustained throughput as the highest rate where execution latency stays under one second.
In 1.3, Kestra sustains 2000 exec/min, 4000 tasks/min. An execution launched on its own runs its two tasks in around 150ms.
In 2.0, Kestra sustains 4000 exec/min, 8000 tasks/min. That is a 2x throughput improvement on the same database and the same VM. An execution launched on its own runs its two tasks in around 120ms, a 20% latency improvement.
The number to look at first as an operator is the p99, though. At 2000 exec/min, which is where 1.3 tops out, the p99 was 694ms. In 2.0 at the same rate it is 159ms. The tail did not shrink by a little, it collapsed, and it stays flat right up to the knee. Resource consumption at high throughput is also a bit lower.
Description
Triggered by a Webhook. Contains 5 If tasks with 2 subtasks each (only one executes per run).
This creates 10 task runs per execution and stresses the Executor.
| step | rate | avg ms | p99 ms | kestra cpu | infra cpu |
|---|---|---|---|---|---|
| 1 | 100 | 570 | 641 | 13.6% | 20.8% |
| 2 | 200 | 601 | 741 | 19.3% | 30.8% |
| 3 | 300 | 647 | 781 | 26.3% | 40.7% |
| 4 | 400 | 867 | 1130 | 31.7% | 48.1% |
| 5 | 500 | 1659 | 2215 | 39.7% | 58.8% |
| 6 | 600 | 10069 | 19253 | 44.2% | 65.5% |
| 7 | 700 | 24501 | 46018 | 45.1% | 66.9% |
| step | rate | avg ms | p99 ms | kestra cpu | infra cpu |
|---|---|---|---|---|---|
| 1 | 100 | 461 | 541 | 11.5% | 15.4% |
| 2 | 200 | 445 | 527 | 15.3% | 23.7% |
| 3 | 300 | 454 | 544 | 20.1% | 28.9% |
| 4 | 400 | 467 | 583 | 24.1% | 38.3% |
| 5 | 500 | 617 | 1010 | 29.1% | 46.5% |
| 6 | 600 | 730 | 1461 | 11.5% | 17.2% |
| 7 | 700 | 1253 | 3441 | 39.7% | 53.5% |
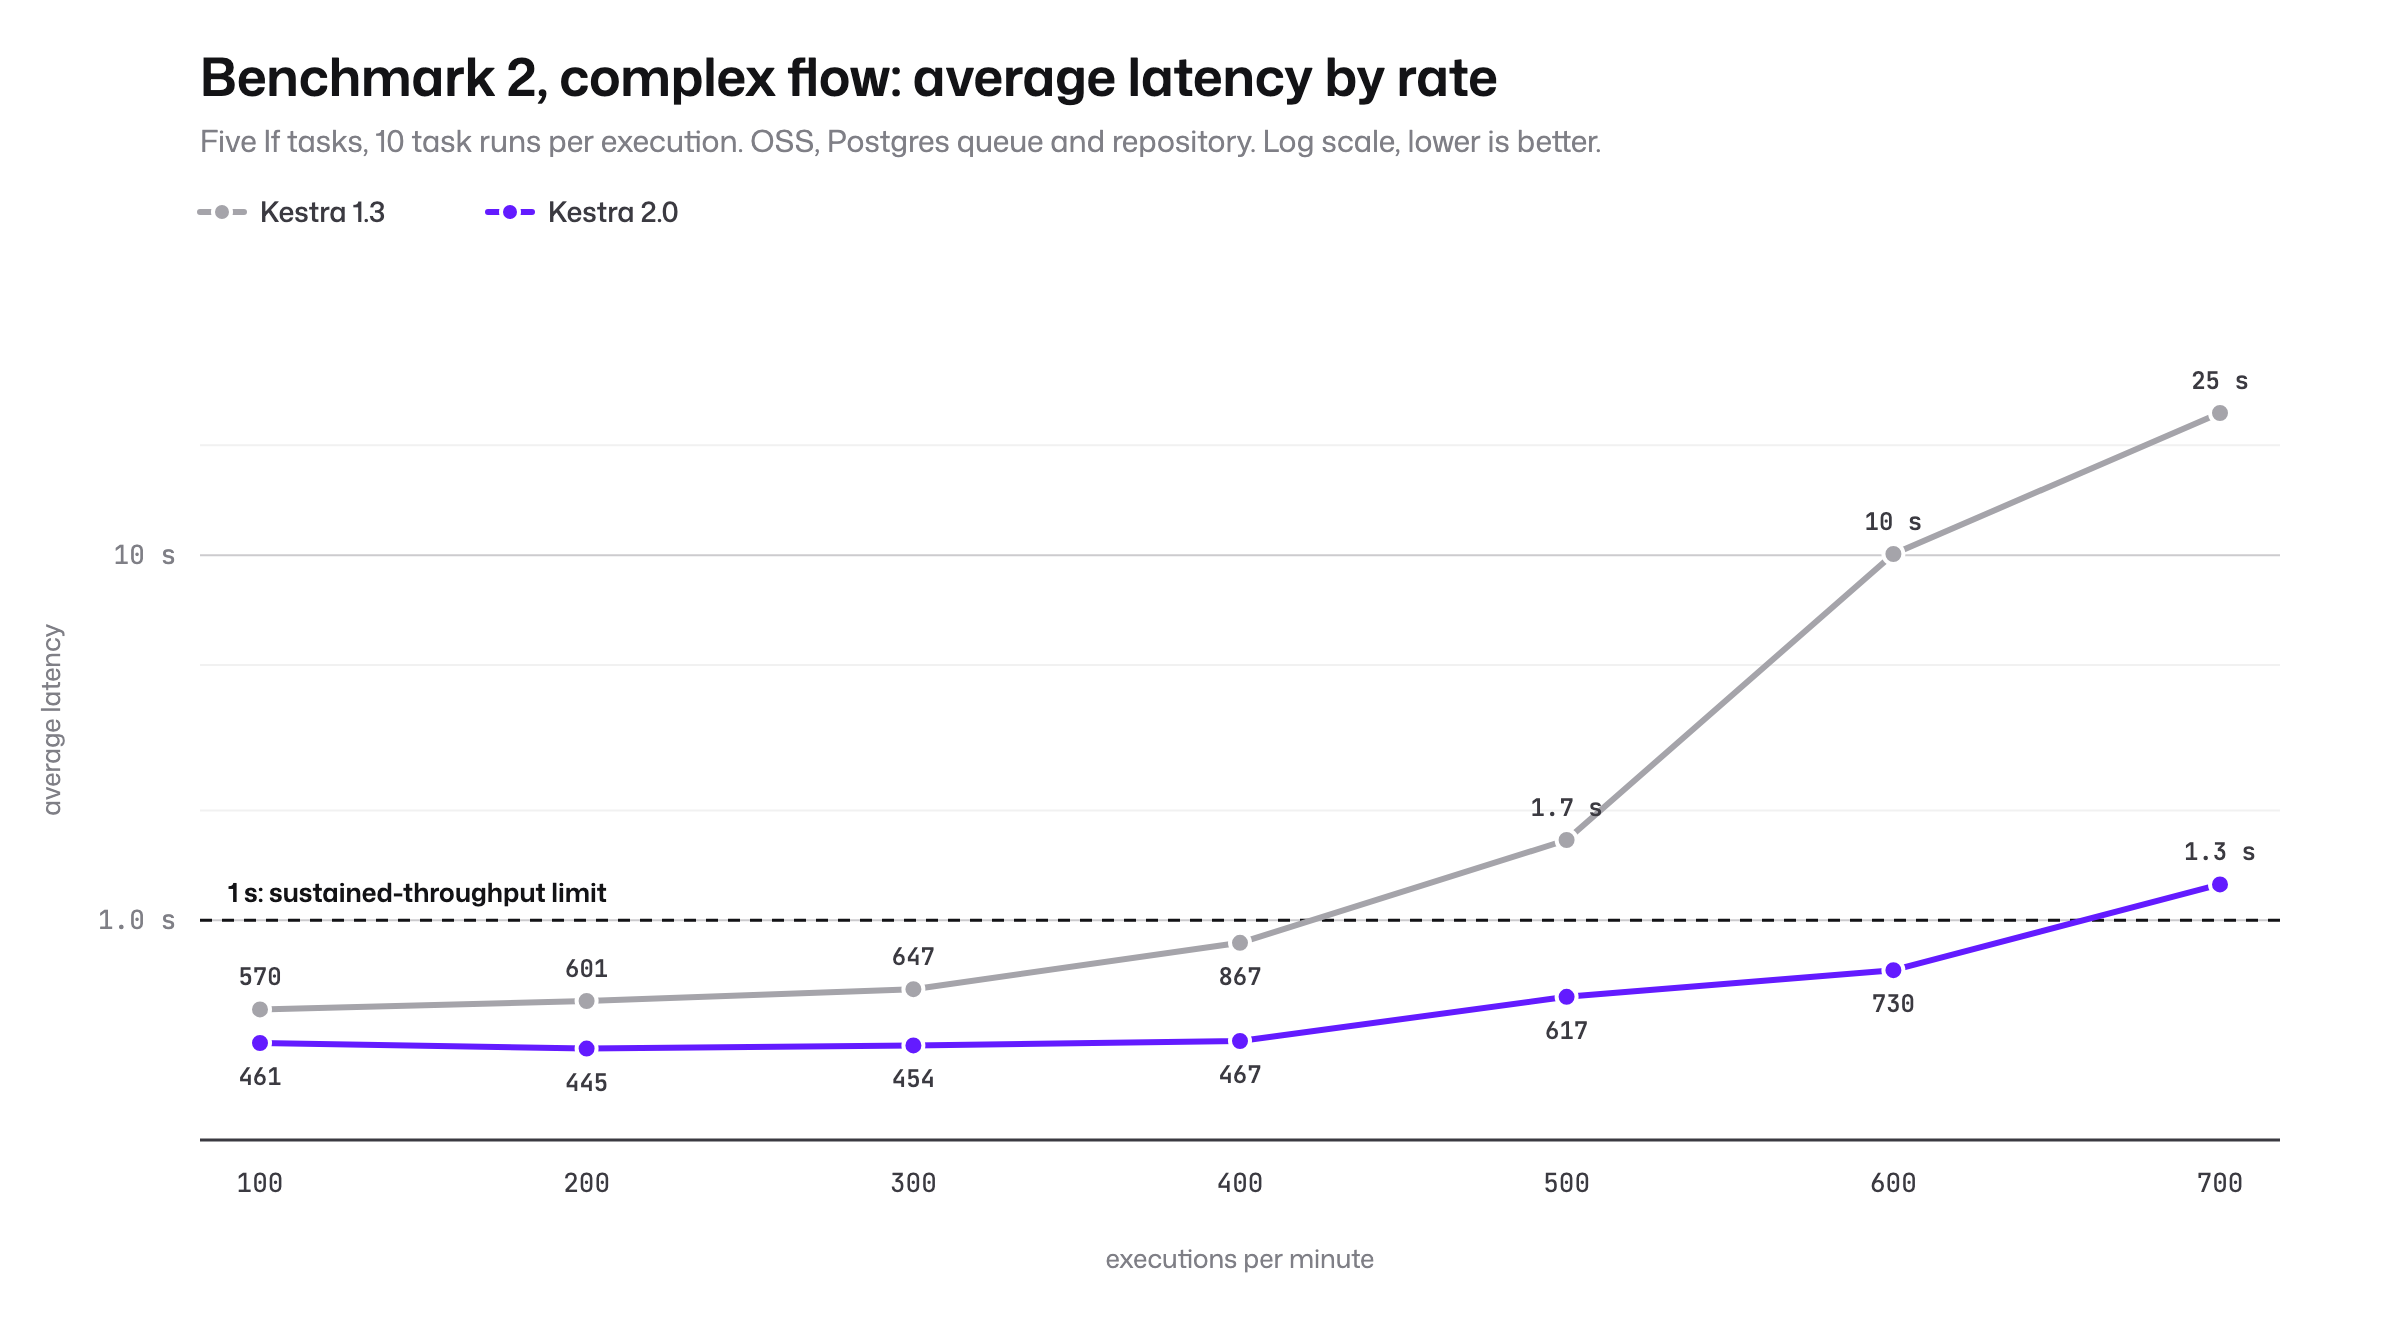
In 1.3, Kestra sustains 400 exec/min, 4000 tasks/min. An execution launched on its own runs its 10 tasks in around 570ms.
In 2.0, Kestra sustains 600 exec/min, 6000 tasks/min, a 50% throughput improvement. An execution launched on its own runs its 10 tasks in around 450ms, a 25% latency improvement.
The gain is smaller than on the simple flow, and that is expected. This benchmark is Executor-bound: ten task runs per execution means ten trips through the execution state machine, and that is the part of the engine that changed least. What did change is visible in the resource columns, where 2.0 does the same work at noticeably lower CPU on both Kestra and the database, at every rate.
Loop taskDescription
Executes 100 iterations of a Loop task, or ForEach task in 1.3, with unbounded concurrency.
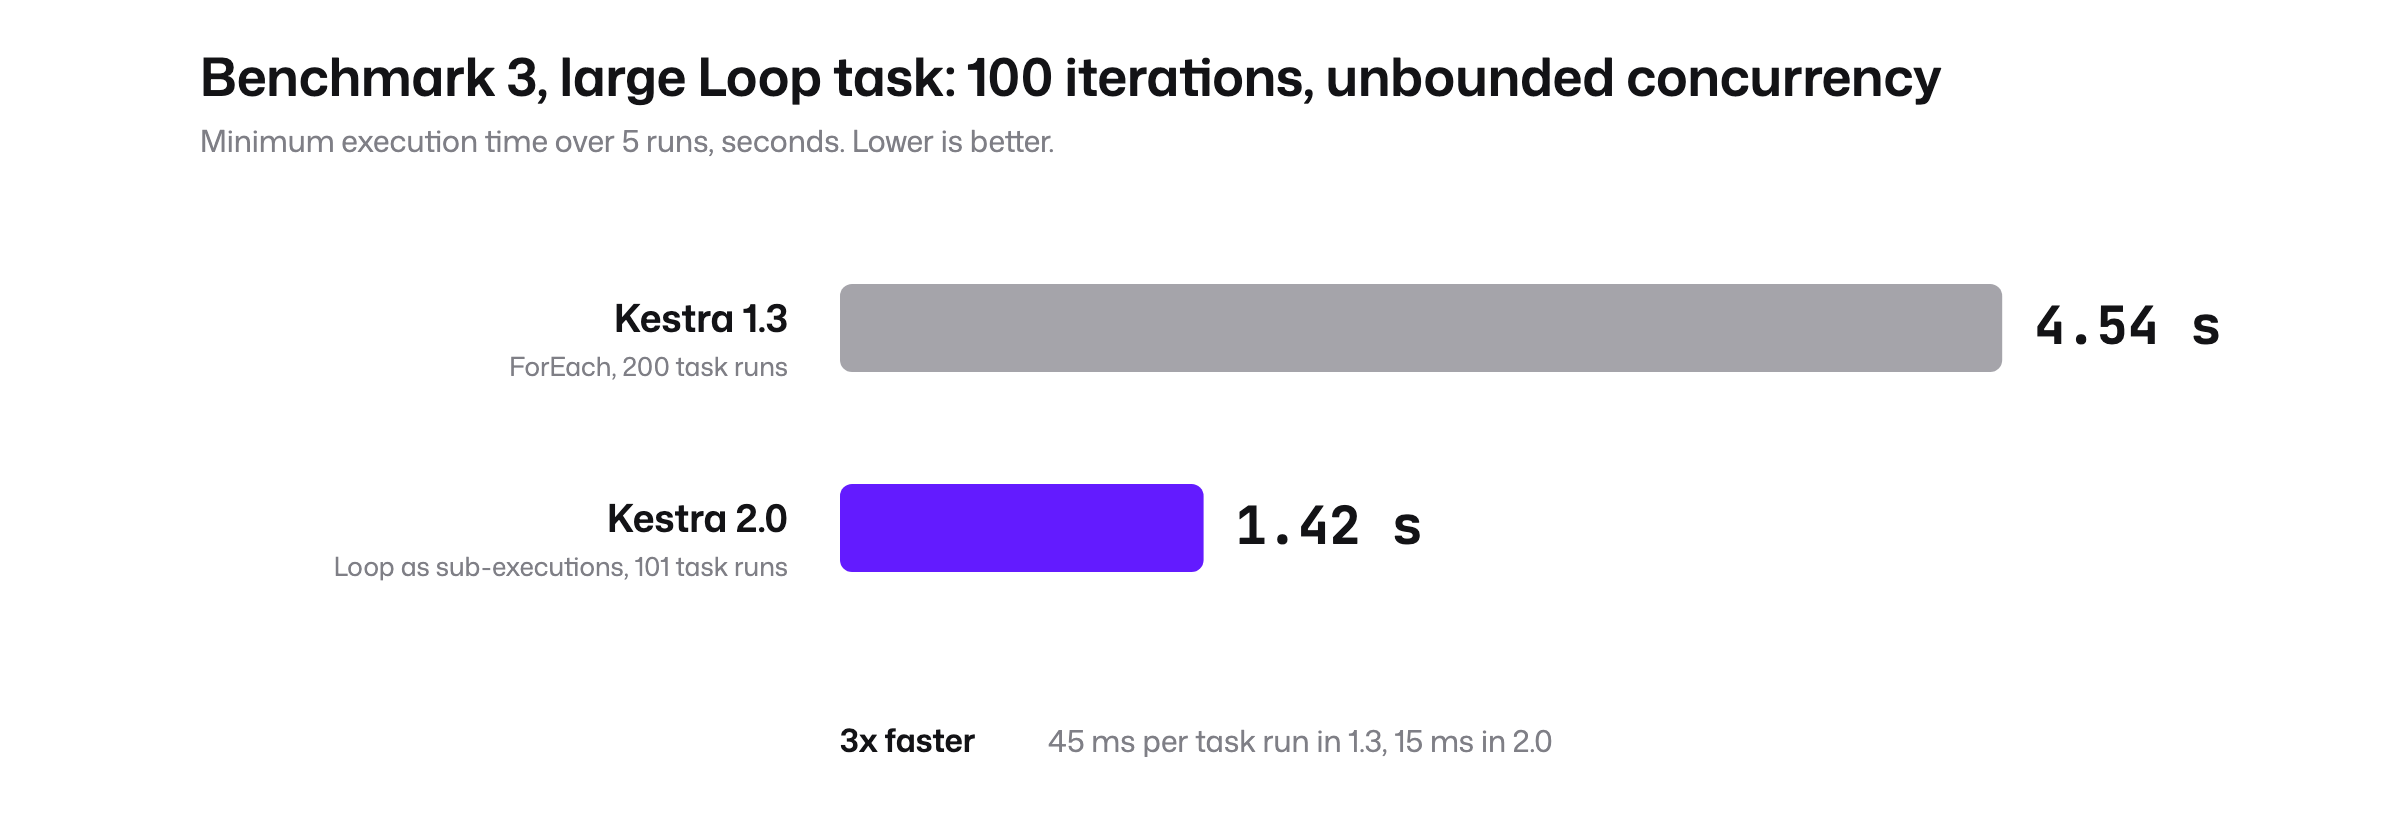
Minimum execution time of 5 runs: 4.54s
Minimum execution time of 5 runs: 1.42s
In 1.3, 100 task runs execute in 4.54s, which is 45ms per task run. In 2.0, 100 task runs execute in 1.42s, which is 15ms per task run.
This is a 3x latency improvement, and it is the one people find counter-intuitive.
In 2.0, loop tasks run as sub-executions, so this benchmark created 100 executions and ran them concurrently. You might expect that to be slower than iterating inside one execution. It is the opposite. Execution overhead is small in Kestra, and moving each iteration into its own execution takes work off the Executor. In 1.3, every ForEach iteration added a task run to the parent execution context, so the context grew with each pass and every update carried all of it. In 2.0 the parent only tracks iteration counters, one per state, so the context stays small and both the Executor and the queue carry far less per message.
The way the Executor processes iterations is also very different. In 1.3 the ForEach task itself was invoked for each iteration, so 200 task runs were executed. In 2.0, a small message is sent when a sub-execution ends, and it only recomputes the iteration count without re-executing the Loop task itself. So only 101 task runs were executed.
None of the numbers above came from a single optimization. They came from changing what an execution costs the engine, in four places.
In 2.0, our queuing mechanism is simpler and more efficient. We support only a single consumer group per queue, so we can delete a message the moment it is consumed.
On JDBC, that means the delete happens in the same transaction as the consume. In 1.3 we had to update the message and then delete it, two round trips instead of one. It also means fewer and smaller indices on the queue table, which lowers the load on the database.
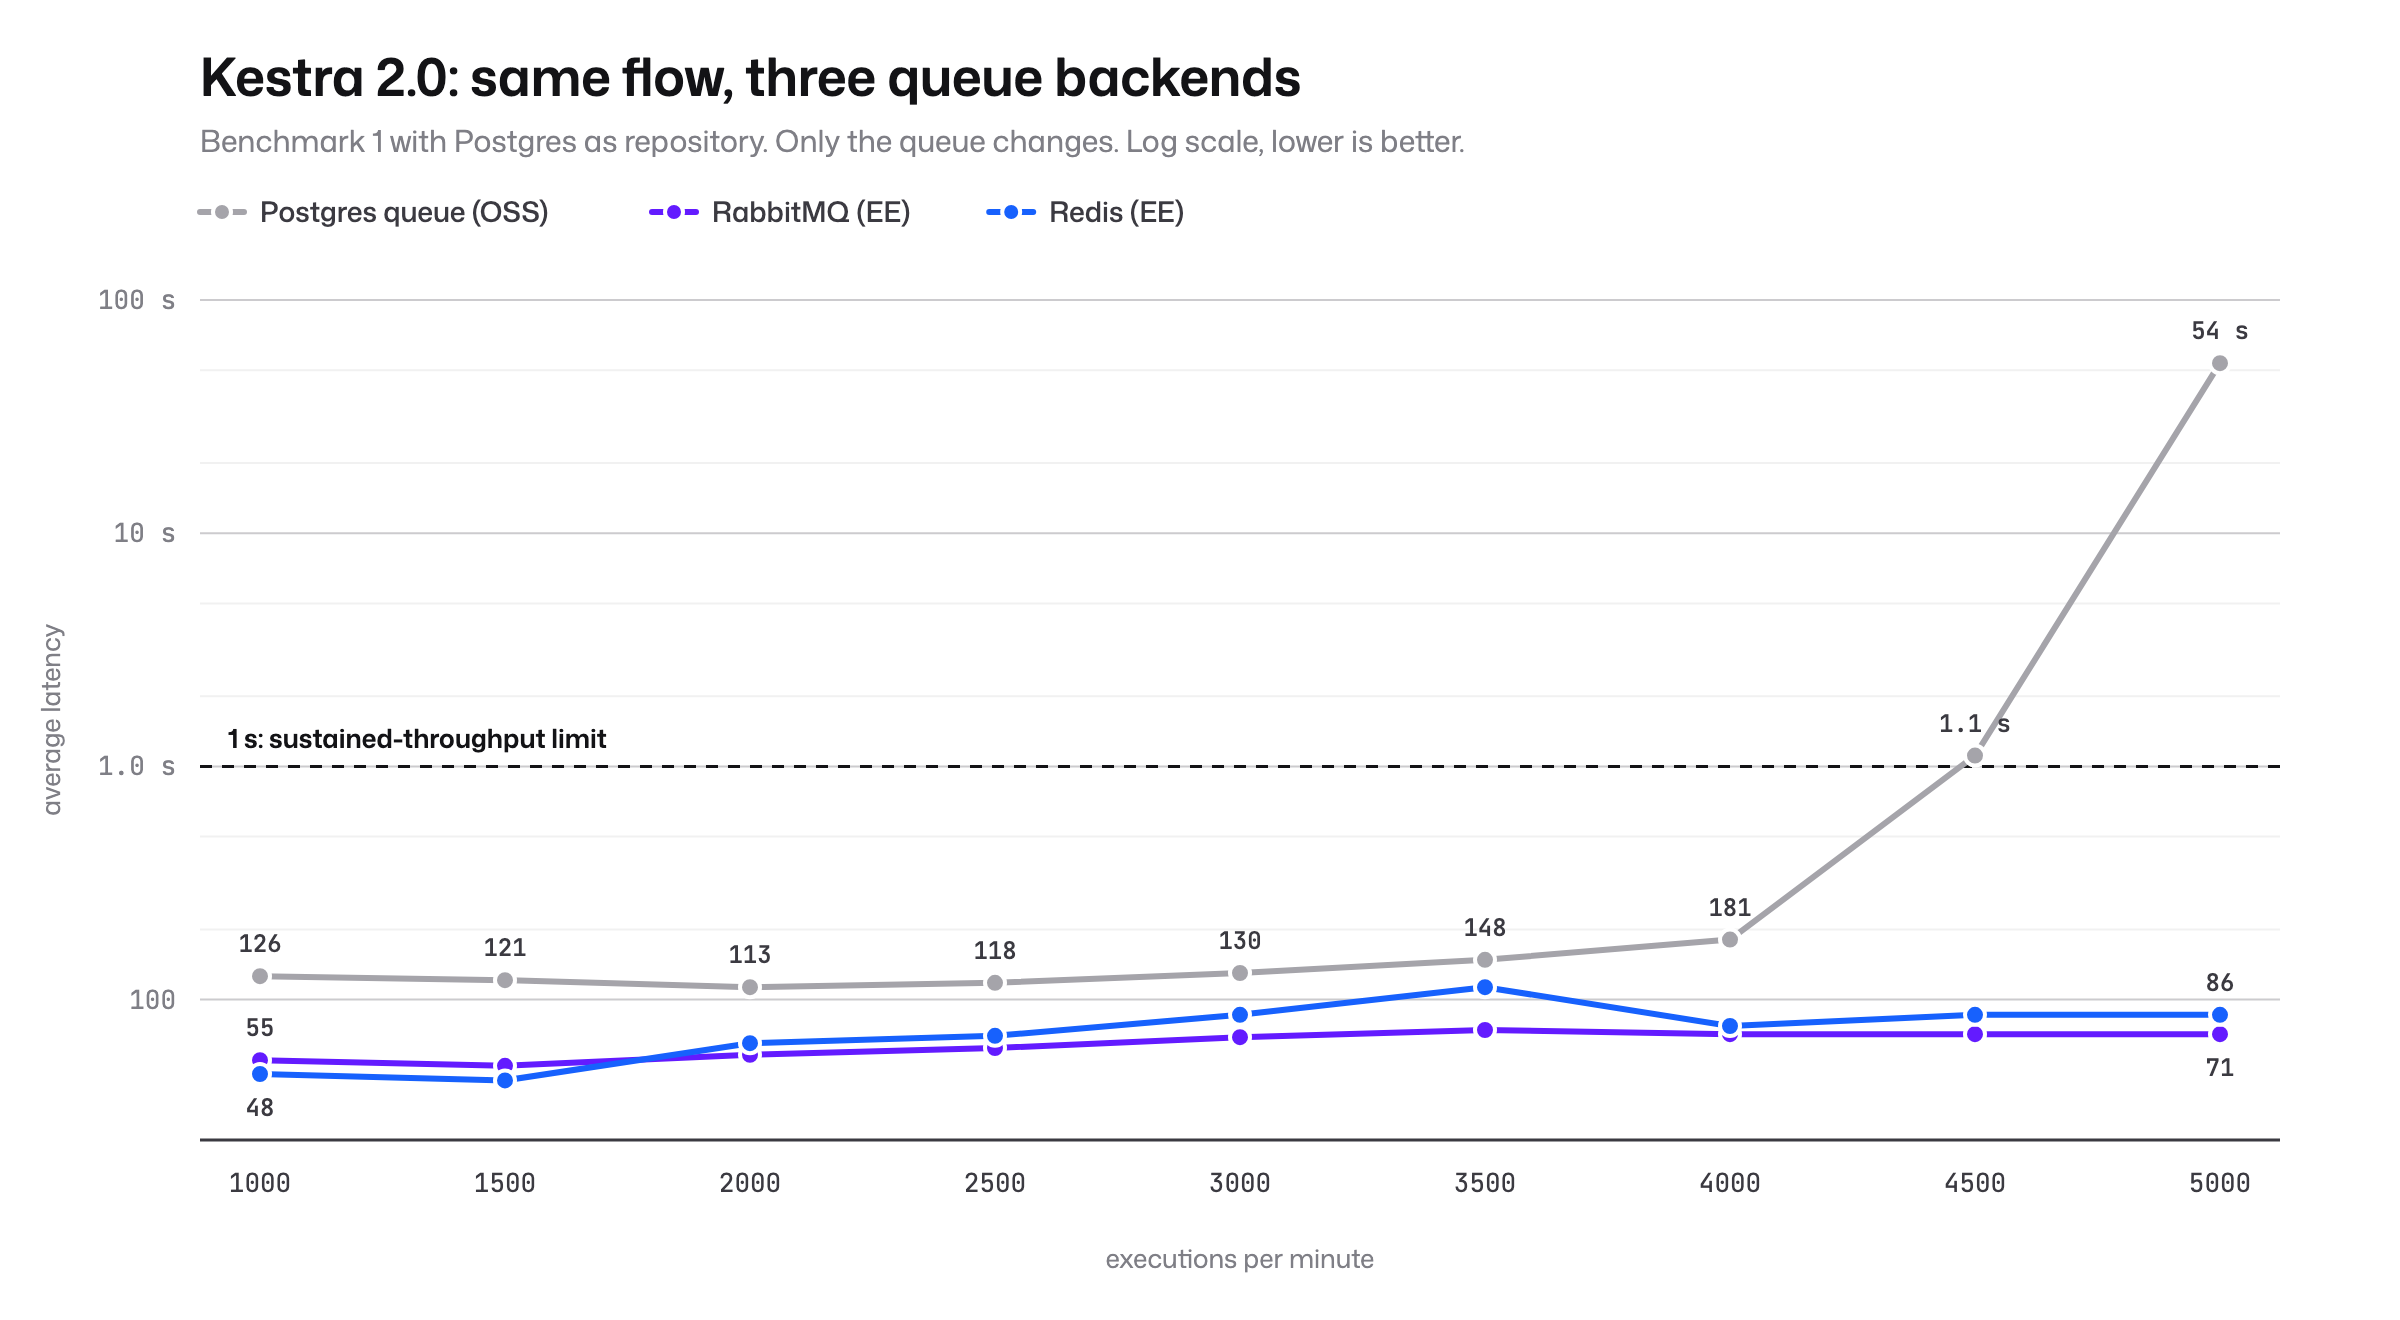
The single consumer group is also what opens the door to brokers that do not support multiple consumer groups natively, RabbitMQ among them. Here is the same simple flow with Postgres as the repository and RabbitMQ as the queue:
| step | rate | avg ms | p99 ms | kestra cpu | rabbitmq cpu | postgres cpu |
|---|---|---|---|---|---|---|
| 1 | 1000 | 55 | 69 | 18.3% | 25% | 15.4% |
| 2 | 1500 | 52 | 70 | 22.5% | 29.2% | 21.2% |
| 3 | 2000 | 58 | 78 | 29.3% | 33.7% | 26% |
| 4 | 2500 | 62 | 89 | 34.1% | 39.2% | 34.6% |
| 5 | 3000 | 69 | 99 | 40.4% | 39.3% | 37.9% |
| 6 | 3500 | 74 | 109 | 45.6% | 43.7% | 43.6% |
| 7 | 4000 | 71 | 102 | 47.4% | 43.3% | 43.9% |
| 8 | 4500 | 71 | 104 | 48.4% | 43.7% | 44.8% |
| 9 | 5000 | 71 | 105 | 49.3% | 46% | 45.8% |
At low throughput, RabbitMQ brings a 50% latency improvement over the Postgres queue in 2.0, and a 60% latency improvement over 1.3. More telling is the shape of the table: average latency sits between 52 and 74ms from 1000 to 5000 exec/min, the p99 never leaves the 69 to 109ms band, and no node passes 50% CPU. There is no knee in this range.
Redis offers the same average latency:
| step | rate | avg ms | p99 ms | kestra cpu | redis cpu | postgres cpu |
|---|---|---|---|---|---|---|
| 1 | 1000 | 48 | 179 | 18.7% | 5% | 17.1% |
| 2 | 1500 | 45 | 189 | 24.6% | 6.2% | 23.3% |
| 3 | 2000 | 65 | 282 | 31.6% | 6.9% | 28.4% |
| 4 | 2500 | 70 | 304 | 35.9% | 8.3% | 36.1% |
| 5 | 3000 | 86 | 362 | 40.1% | 8.7% | 38.7% |
| 6 | 3500 | 113 | 565 | 15.4% | 3.7% | 14.3% |
| 7 | 4000 | 77 | 130 | 50.1% | 10% | 49.5% |
| 8 | 4500 | 86 | 146 | 53.7% | 10% | 52.7% |
| 9 | 5000 | 86 | 185 | 59.9% | 11.2% | 57.3% |
Redis itself barely works, staying near 10% CPU across the whole run, and Kestra holds 5000 exec/min at 86ms average. Step 6 is a transient stall, not a load effect: CPU dips on every node at once and recovers on the next step.
All queue messages are now designed to be lightweight. The execution itself no longer travels inside them.
Where applicable, we use a Command pattern. Restarting an execution in 1.3 meant sending the whole execution through the queue. In 2.0 only a Restart command is sent. That let us implement a single-writer principle: only the Executor writes the execution, and only the Scheduler writes the trigger. It closes a class of races and subtle ordering issues on both.
The other big change is that task outputs now live outside the execution. In Kestra, a task that computes outputs used to store them inside the execution. In 2.0 those outputs go to a separate table. That relieves the Executor’s memory and lets us load outputs only when something actually needs them. This is still a work in progress, and there is more to gain here.
It is hard to list everything, and each item on its own is small. They add up.
logs table, which is the table receiving the highest number of inserts.UPDATE. We previously used INSERT ON CONFLICT UPDATE, which raises the cost of each execution write. The Executor already knows whether an execution needs creating or updating, so it can issue the right query directly and skip the key-presence check.Instant deserialization. Since we own the serialization format, we added a fast path for it. This one only became visible when running on our low-latency AMQP setup: once the queue stops being the most expensive thing in the pipeline, smaller costs that used to hide under the JDBC noise show up and can be fixed.The Worker is now built on a SEDA architecture.
It polls the new Controller for jobs over gRPC and places them on an in-memory queue. An event loop prefetches jobs and hands them to platform threads for processing. Prefetching and batching job reception keeps worker threads busier and raises overall throughput.
Logs and metrics are now sent in batches as well, which noticeably lowers resource usage and latency for executions that produce a lot of them.
Look at the CPU columns in Benchmark 1 again. In 1.3, latency falls off a cliff at 2500 exec/min while Kestra sits at 43% CPU and Postgres at 64%. In 2.0 the same thing happens at 4500 exec/min with Kestra at 58% and Postgres at 69%. In both versions, the hardware is not saturated when latency goes vertical.
The wall is row-level lock contention in Postgres, not compute. The executions row lock (the select ... for update and the update that follows it) dominates database time at every rate, and at saturation the queue poll (select ... skip locked) becomes the single largest consumer. 2.0 moved that wall from 2000 to 4000 exec/min by doing less work per execution, but past the knee it is Postgres holding the line, and Kestra CPU actually drops because the engine is waiting on the database.
That is the point of separating the queue from the repository in 2.0. When Postgres stops being the queue, the contention on the queue table disappears, which is exactly what the RabbitMQ and Redis tables above show: same flow, same VMs, same Postgres repository, and latency stays flat to 5000 exec/min with every node under 60% CPU. The remaining database cost is the executions row lock on the repository, and it grows with load but never becomes the limit inside this range.
On the same flows, the same VMs, and the same Postgres, Kestra 2.0 sustains twice the throughput of 1.3, cuts single-execution latency by 20 to 25%, runs a 100-iteration Loop 3x faster, and keeps the p99 flat all the way to the knee instead of degrading from the first step. None of that required a change to a single flow.
The improvements came from making each execution cheaper for the engine: a queue that deletes on consume, messages that carry commands instead of executions, outputs stored outside the execution, and a Worker that batches. The reference benchmarks are on the benchmark page and will be updated with each release.
If you need more than 4000 exec/min, the answer in 2.0 is no longer a bigger Kestra node. It is a queue that is not also your repository. The backend guide walks through how to pick one.
None of these numbers require a flow change, only an upgrade: the steps are in the 2.0 migration guide.
If you have any questions, reach out via Slack or open a GitHub issue.
If you like the project, give us a GitHub star and join the community.

Stay up to date with the latest features and changes to Kestra