Authors

Martin-Pierre Roset
Martin-Pierre Roset
We announced the Kestra Add-on for Splunk. This post covers what production users do with it, and with the rest of the Splunk integration, once it’s installed.
The same few patterns keep coming back, and so do the same design questions: how much of the alert to pass along, how to keep the same fix from running twice at once, where a human should sign off, and how to get the result back into Splunk.
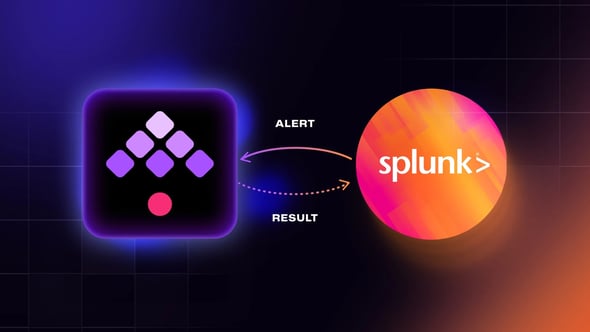
Splunk to Kestra goes through the add-on. A Trigger Kestra Flow alert action starts a flow when an alert fires. You pick the Kestra connection, tenant, namespace and flow per alert, and the add-on calls the Kestra Executions API with:
$result.host$, each sent as a flow inputAPI tokens sit encrypted in Splunk’s credential store, and the kestra_alert_user role lets alert owners add the action without Splunk admin rights.
Kestra to Splunk goes through the Splunk plugin in Kestra Enterprise:
Search runs an SPL query against the management API, polls until the job finishes and stores the results in Kestra’s internal storage for the next task. Killing the execution, or a graceful worker shutdown, cancels the Splunk search job too, so nothing keeps running on your search head.Send posts events to the HTTP Event Collector, either a raw payload or a file from internal storage, with the index and sourcetype you choose.LogExporter, used with LogShipper or AuditLogShipper, ships execution logs and audit events to HEC.Remediation usually starts from an alert that fires every week: a server stuck at 100% CPU, a service that stopped responding, a disk filling up. The goal is a shorter mean time to recovery.
Without automation, an engineer reads the alert, works out the cause and opens or updates the ServiceNow incident by hand. With the add-on, the Splunk alert starts a Kestra flow that opens the incident, runs the Ansible playbook that fixes the host, and records the result. Restarting or killing a service waits for an approval.
id: splunk_high_cpunamespace: infra.remediation
concurrency:  limit: 1  behavior: QUEUE
inputs:  - id: host    type: STRING  - id: search_name    type: STRING  - id: search_id    type: STRING  - id: results    type: FILE
tasks:  - id: tag    type: io.kestra.plugin.core.execution.Labels    labels:      host: "{{ inputs.host }}"      splunk_search_id: "{{ inputs.search_id }}"
  - id: open_incident    type: io.kestra.plugin.servicenow.CreateIncident    domain: "{{ secret('SNOW_DOMAIN') }}"    username: "{{ secret('SNOW_USERNAME') }}"    password: "{{ secret('SNOW_PASSWORD') }}"    shortDescription: "{{ inputs.search_name }} on {{ inputs.host }}"    urgency: "2"
  - id: approve_restart    type: io.kestra.plugin.ee.flow.HumanTask    assignment:      groups:        - Platform On-Call    pauseDuration: PT30M    behavior: CANCEL    onResume:      - id: reason        type: STRING        defaults: "approved from the incident"
  - id: restart_service    type: io.kestra.plugin.ansible.cli.AnsibleCLI    timeout: PT15M    retry:      type: constant      interval: PT1M      maxAttempts: 2    namespaceFiles:      enabled: true    commands:      - ansible-playbook -i "{{ inputs.host }}," restart_service.yml
- id: report_back type: io.kestra.plugin.ee.splunk.events.Send host: "{{ secret('SPLUNK_HEC_HOST') }}" token: "{{ secret('SPLUNK_HEC_TOKEN') }}" index: remediation sourcetype: kestra:remediation eventData: '{"host": "{{ inputs.host }}", "search_id": "{{ inputs.search_id }}", "incident": "{{ outputs.open_incident.number }}", "execution_id": "{{ execution.id }}", "status": "restarted"}'The host and the search name drive the logic, so they arrive as typed inputs. Everything else stays in the CSV file, which the flow can parse or attach to the incident. If the alert definition in Splunk changes and a mapped field disappears from the payload, the flow fails fast on the missing required input instead of half-running. If a token resolves to an empty value, the flow receives an empty string and runs anyway, so check host before the first task acts on it.
An alert that fires every five minutes on a flapping host would otherwise start a new remediation each time. Splunk’s alert throttling, set per host, removes most duplicates at the source. The flow’s concurrency block queues whatever gets through and runs it one execution at a time, so two restarts never run at the same time. The Labels task tags each execution with the host and the Splunk search ID, which makes “what did we already do for this host today” a filter in the Kestra UI.
The HumanTask holds the restart and assigns the approval to the on-call group, so the request lands with the people allowed to approve it. They resume it from the UI or the API, and the reason is recorded on the execution. After 30 minutes without an answer, the execution is cancelled rather than left hanging. Low-risk fixes, such as clearing a temp directory, usually skip the approval entirely.
The Send task writes the outcome to a dedicated index with the original search ID, the ServiceNow incident number and the Kestra execution ID. An analyst investigating the alert in Splunk sees that it was remediated, when and by which execution, without leaving Splunk.
When sites sit on separate networks and no control plane may span IT and OT, remote worker groups run the playbook inside each site. The Splunk alert, the approval and the audit trail stay central, and the fix runs locally on a worker that only needs outbound access to Kestra. Remote worker groups are a Kestra Enterprise feature.
Some teams don’t start from an alert. They want Splunk results as one input among several, for example to score vulnerabilities by risk with findings from Splunk alongside Qualys, Snyk, Sysdig and CrowdStrike. Others run a nightly SPL query to build a report or decide which hosts a patch wave should skip.
id: hosts_with_errorsnamespace: infra.reporting
triggers:  - id: nightly    type: io.kestra.plugin.core.trigger.Schedule    cron: "0 2 * * *"
tasks:  - id: search    type: io.kestra.plugin.ee.splunk.events.Search    host: "{{ secret('SPLUNK_HOST') }}"    token: "{{ secret('SPLUNK_TOKEN') }}"    maxWaitSeconds: 600    query: 'search index=os sourcetype=syslog level=error earliest=-24h | stats count by host'
Keep the heavy lifting in SPL. A stats or dedup in the query returns a few hundred rows instead of a few million raw events, and the next task in the flow (a Python script, a SQL query or a patch wave) works from that summary. maxWaitSeconds bounds how long the flow waits for a slow search.
The same task works as a gate. Before a change window, a flow can search for open critical alerts on the target hosts and stop the wave for any host that has one.
When a platform team provisions a VM, Splunk registration is one of the steps, next to DNS and the CMDB. Those three steps run in parallel once vSphere or Nutanix has built the machine, usually inside a Parallel task, so the chain waits only for the slowest of the three.
If any of them fails, the flow’s errors branch deregisters the host from Splunk and DNS, removes the CMDB entry and deletes the VM, so no machine is left half-registered. Because the whole chain is one execution, the record shows which step failed and what the rollback undid.
The simplest setup sends Kestra’s logs to Splunk, where security teams and auditors already look.
LogShipper sends execution logs and AuditLogShipper sends audit events (who created, changed or ran which flow, and when), both through the Splunk LogExporter. The Ship Kestra logs to Splunk blueprint runs it as a daily system flow:
id: splunk-log-shippernamespace: system
triggers:  - id: daily    type: io.kestra.plugin.core.trigger.Schedule    cron: "@daily"
tasks:  - id: log_export    type: io.kestra.plugin.ee.core.log.LogShipper    logLevelFilter: INFO    lookbackPeriod: P1D    offsetKey: logShipperOffset    logExporters:      - id: SplunkLogExporter        type: io.kestra.plugin.ee.splunk.LogExporter        host: https://example.splunkcloud.com:8088        token: "{{ secret('SPLUNK_API_KEY') }}"
The offsetKey keeps a cursor between runs, so each run sends only new entries. Two settings are worth tuning: shorten the schedule to every 15 minutes or hourly so alerts on Kestra activity fire close to real time, and raise logLevelFilter to WARN on busy instances to keep Splunk ingestion costs down. A separate HEC token and index for Kestra makes retention and access rules easier to set on the Splunk side.
Teams moving scheduled jobs off cron and systemd timers use the same setup. Their jobs get a central view in Kestra, and the logs still end up in Splunk, where the rest of the company already searches.

Stay up to date with the latest features and changes to Kestra