
Authors
Benoit Pimpaud
Benoit Pimpaud
Data Warehouse solutions can sometimes become costly, especially with an uptick in data processing demand. Cloud-based data warehouses like Google BigQuery offer significant advantages in terms of scalability and performance. Yet, with great scalability comes great responsibility, managing your resources usage effectively.
BigQuery is very fast and easy to use. But it can be very expensive, especially when running scheduled queries: you’re not here to look at the bytes billed every time you’re query run.
In the example below, we create a Kestra task to run a query on a Big Query table. To schedule our query, we just add a Kestra Trigger with a cron property allowing us to run the query every hour.
id: query_eventsnamespace: company.sales
tasks:
  - id: query    type: io.kestra.plugin.gcp.bigquery.Query    sql: |      SELECT        SUM(price) as sum_price      FROM sales.event_partitioned      WHERE date = '{{ trigger.date }}'
triggers: - id: schedule type: io.kestra.plugin.core.trigger.Schedule cron: "0 * * * *"First, we establish a task, identified as query_events, in the sales namespace.
The task contains a single task (or step), identified as query. The type of this task indicates it uses the BigQuery plugin to execute SQL queries.
The SQL query is structured to select the sum of a price column from a BigQuery table named sales.event_partitioned, with the condition that the date equals the scheduled date.
The task also includes a schedule trigger. This is a type of Schedule trigger, which uses a cron format string to schedule when the task will be executed. The cron string 0 * * * * indicates that the task will run every hour, on the hour.
So, Kestra will execute this task every hour, running the specified SQL query on the BigQuery sales.event_partitioned table, for the current date, and store the result. The BigQuery query task expose metrics such as the total bytes processed, the query duration or the number of referenced tables, and more.
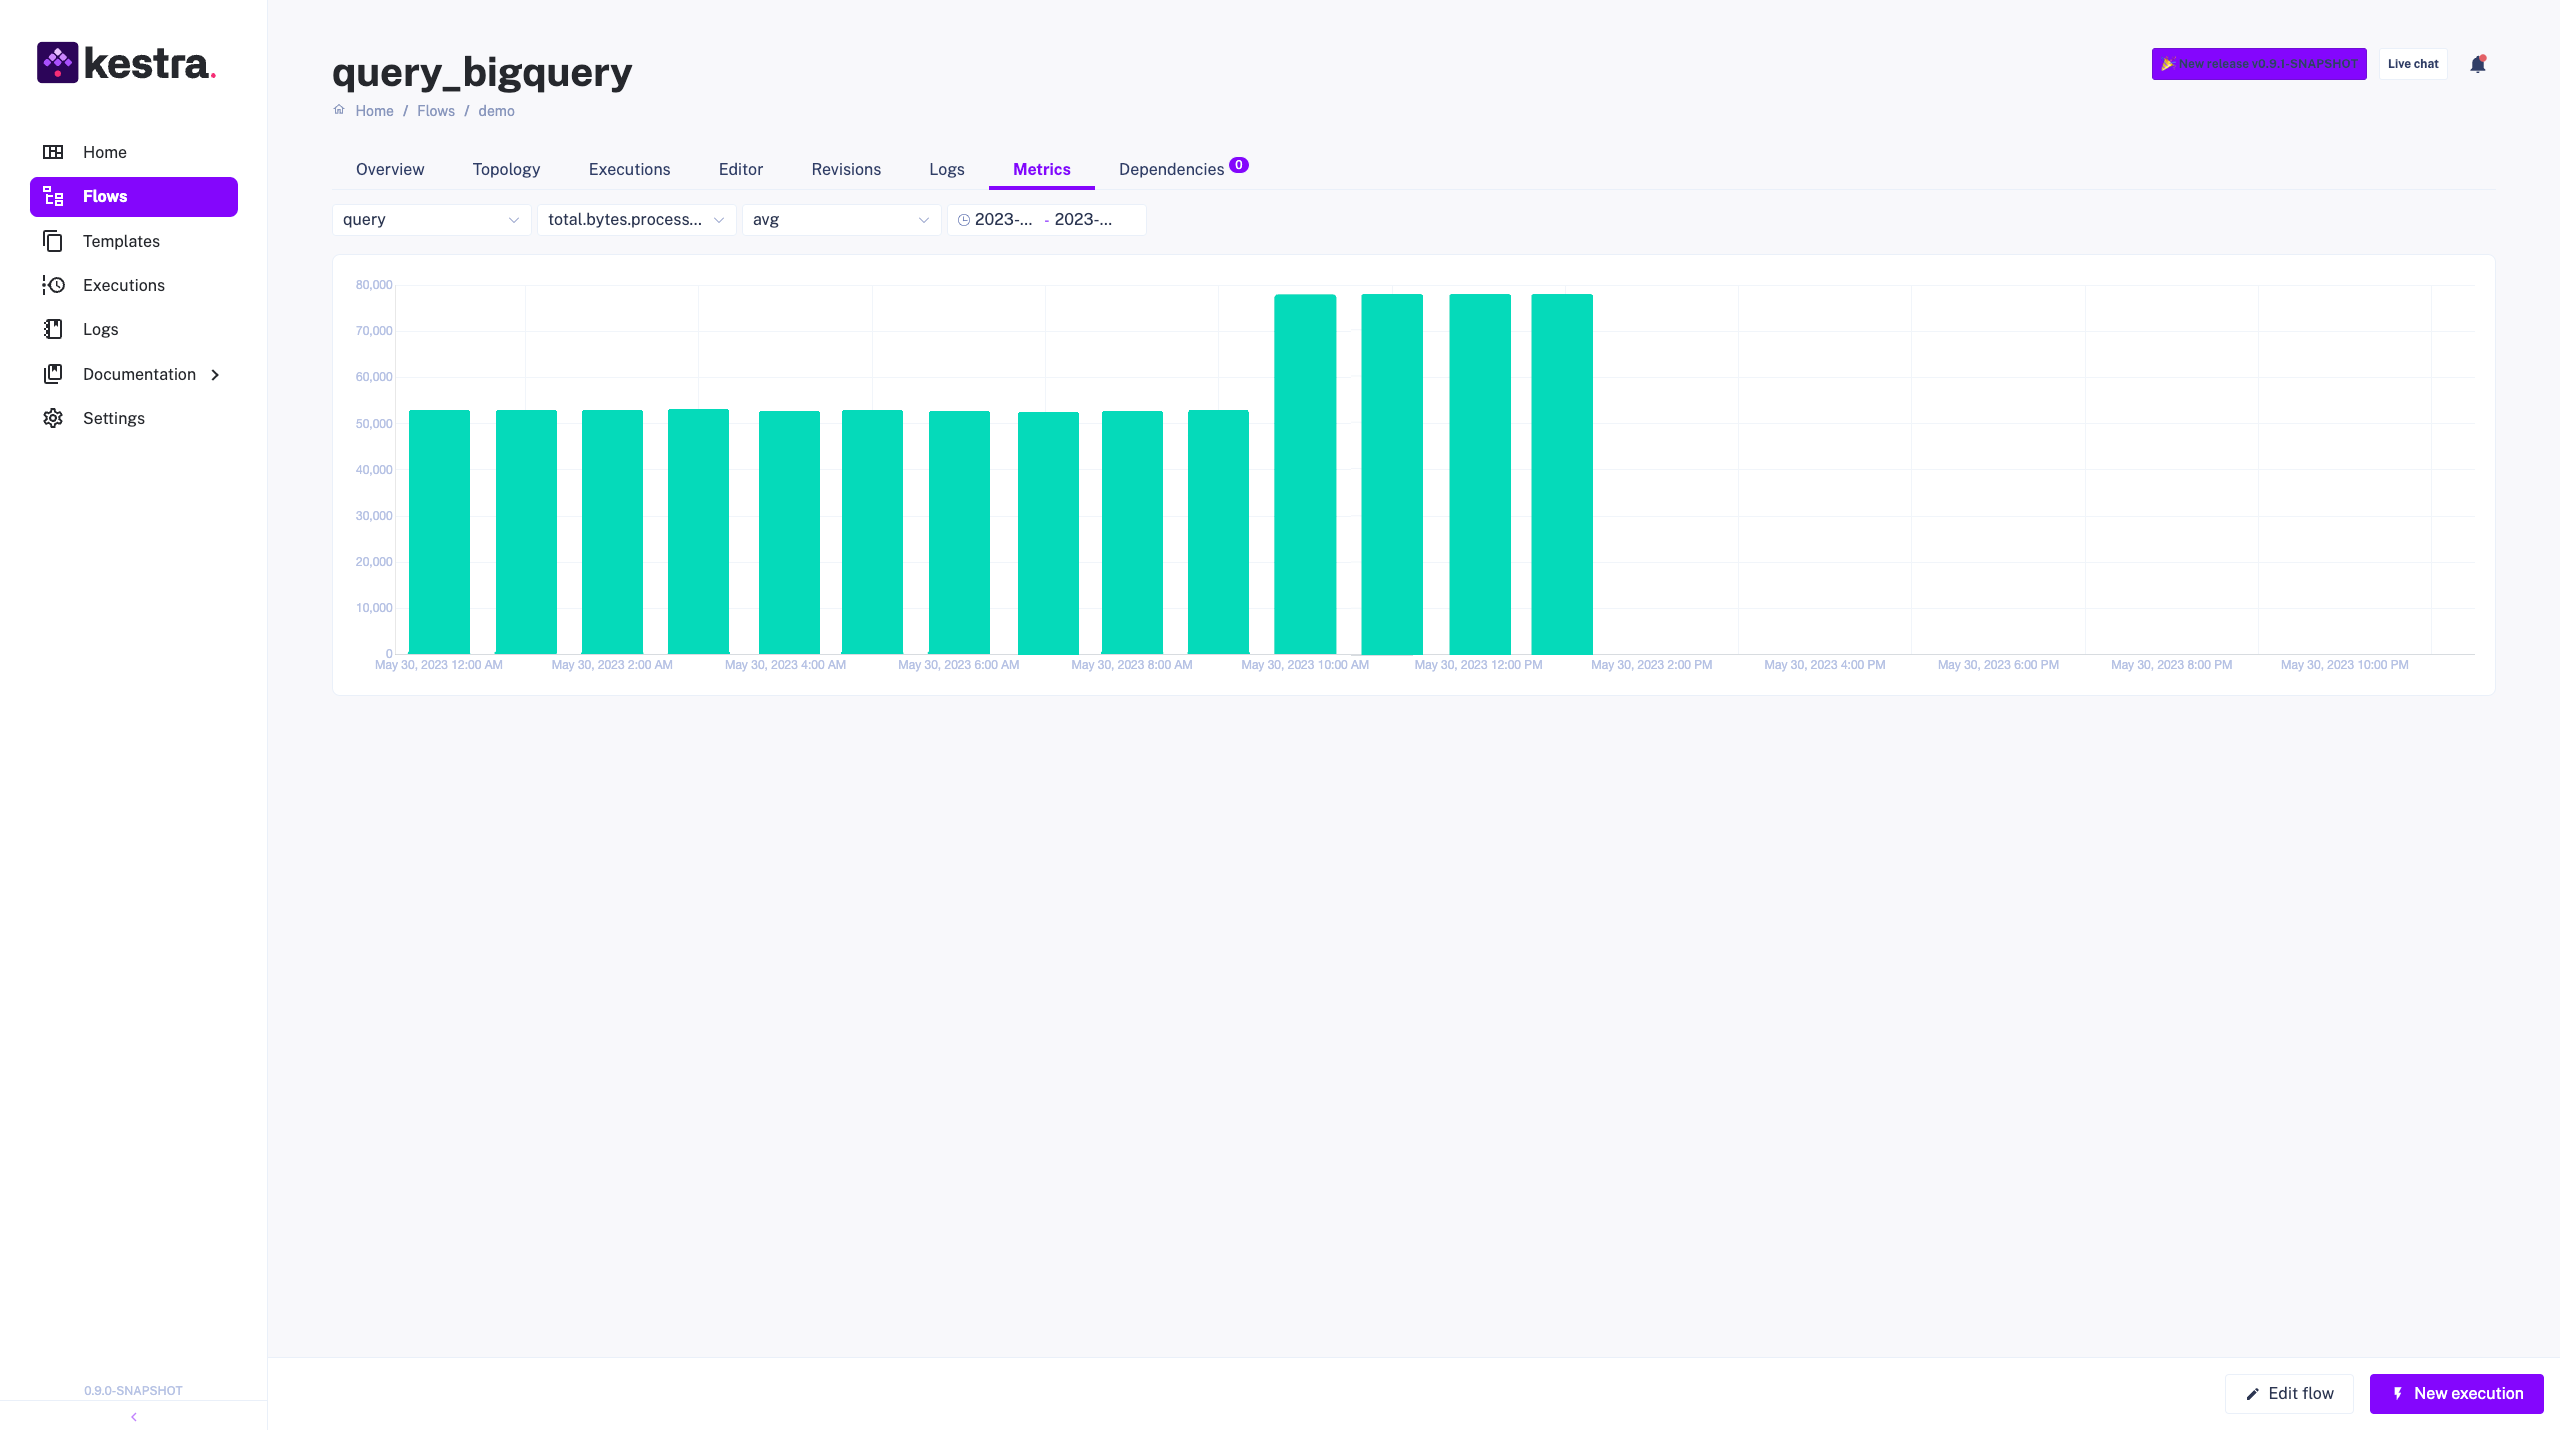
The Metric dashboard provides a seamless way to look at metrics for every Flow execution. In our example we can see that at some point our query processed more bytes than before - growing our BigQuery bill.
Enabling the monitoring of your resource usage can proactively spot areas of optimization, ensuring cost efficiency as you scale.
For instance, a spike in bytes processed during certain hours may suggest the need to reschedule the most data-intensive tasks to off-peak hours if workloads allow. By closely monitoring the ‘Bytes Processed’ metric, you can then manage your resource allocation and usage.
The Metric Dashboard feature goes beyond just tracking cloud resource usage. Its versatility allows you to monitor a broad array of metrics, from ones like BigQuery to custom metrics that cater to your specific data processing tasks. You can gain insights into your ETL processes, track the number of processed lines, monitor processing time per batch, and so much more.
In future releases we will add proper SLA capabilities: the idea would be to let users use the Metrics presented in this article as a SLA to stop a Flow to run or trigger an alert for example. You will be also able to have a complete dashboard with all the metrics gathered by Kestra with an overview on what happen in your data pipeline.
For a deeper exploration of the potential applications of the Metric Dashboard you can learn more with our documentation.
Join the Slack community if you have any questions or need assistance. Follow us on Twitter for the latest news. Check the code in our GitHub repository and give us a star if you like the project.

Stay up to date with the latest features and changes to Kestra