Authors
Benoit Pimpaud
Benoit Pimpaud
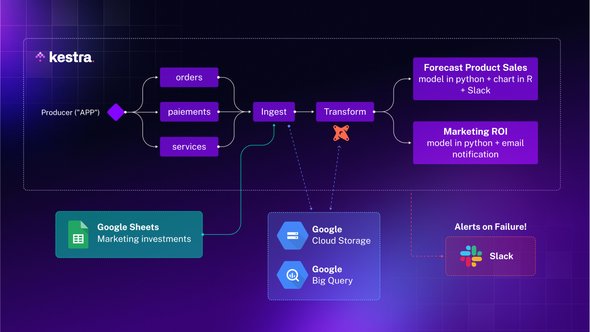
Welcome to the world of Shiny Rocks! Although this company might not exist outside Kestra it has its own purpose.
We often face the challenge of presenting concepts without real data, due to privacy concerns or practicalities.
Shiny Rocks is a fictional company creating smartphones. “Those shiny rocks in our pockets”. It provides a means to showcase various data use cases in a realistic manner. In this post, we are not just introducing this mock company, but also offering datasets it “produces” for your hands-on experience. Plus, in the future, anticipate more of Shiny Rocks; it’s going to be our gimmick to bring plausible data scenarios, especially when we dive deep into use cases with Kestra.
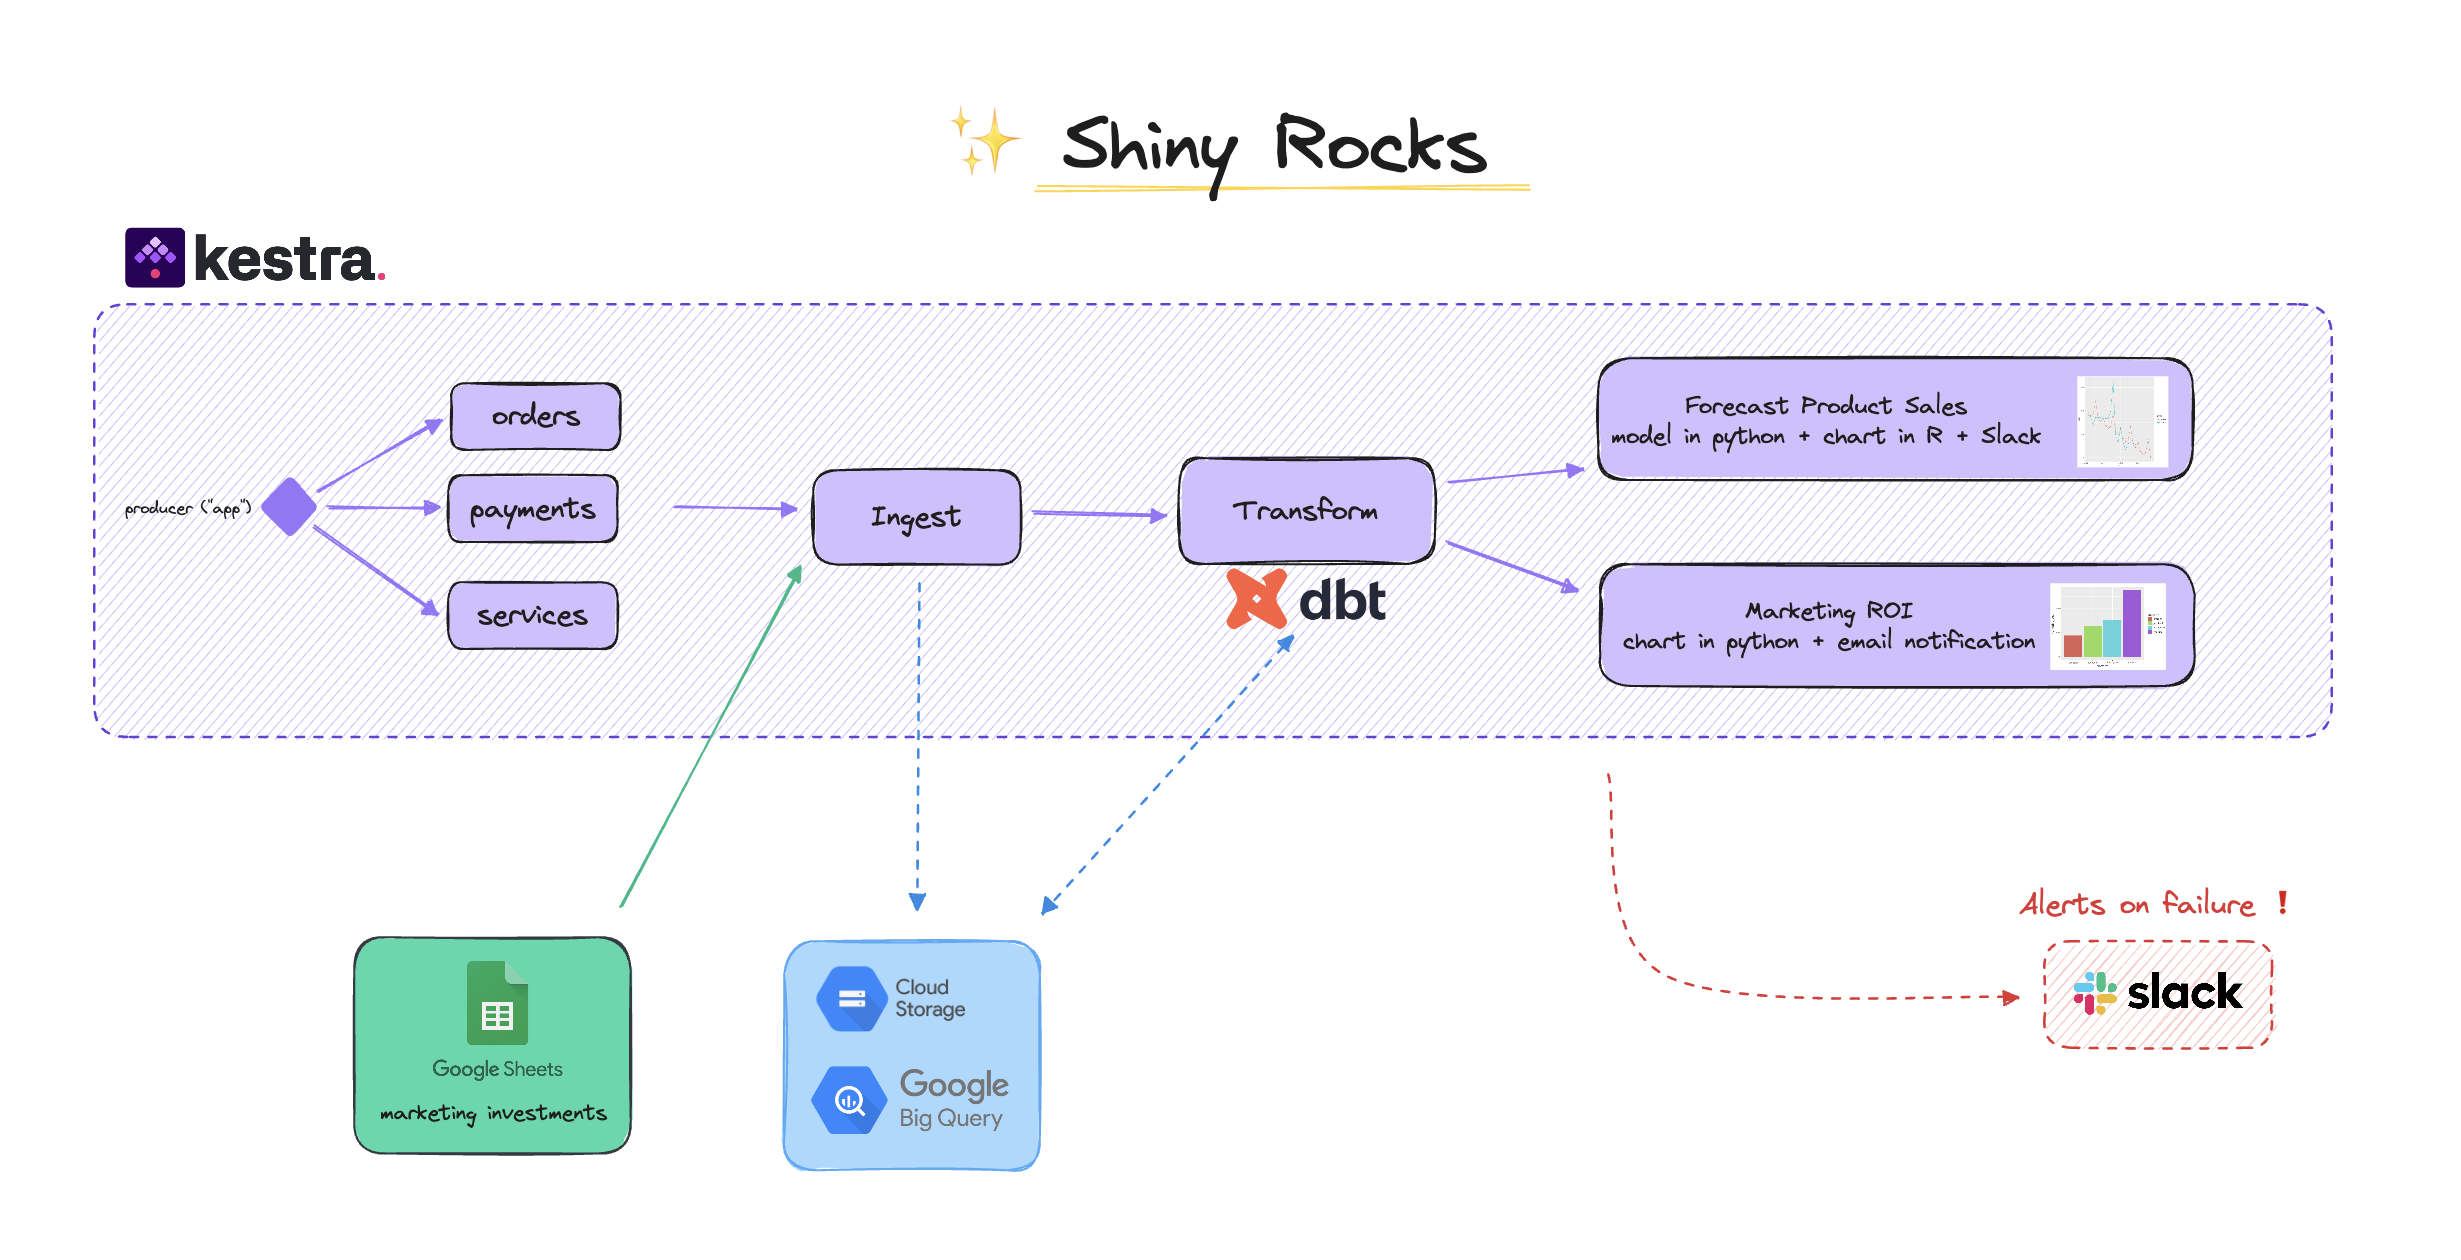
You can find the whole use case in our live demo in the shiny_rocks namespace.
Unlike static files that don’t change, Shiny Rocks comes with custom scripts that generate fresh data every day. These scripts rely on a mix of mathematical functions to simulate various trends for our imaginary company.
Here is for example the mathematical function used to generate orders volume over a year.
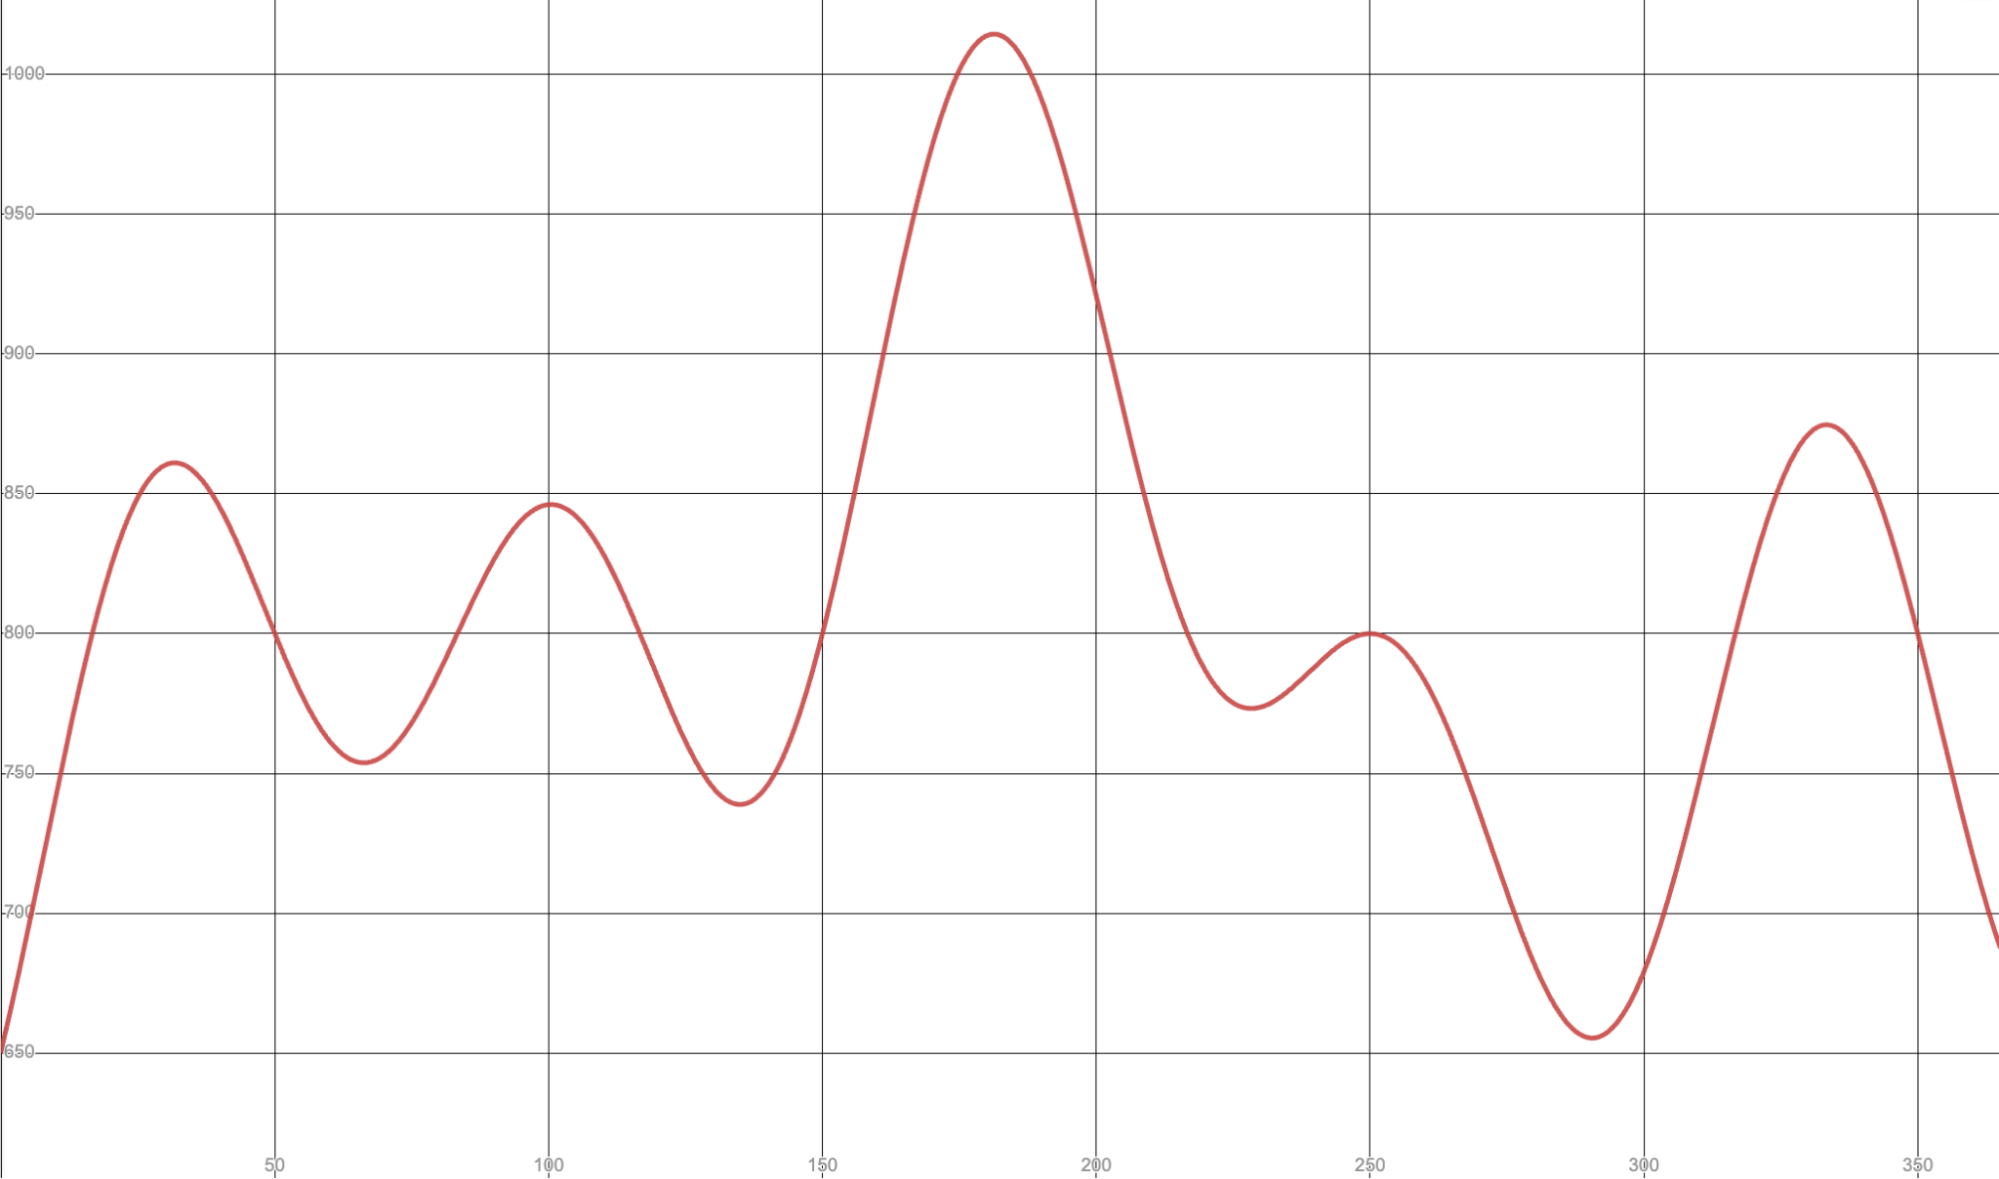
To create those fake data, we lean on the Faker python library, supplemented by our custom provider.
Our datasets include:
By using distribution functions, we’ve given these datasets diverse and random attributes.
For example we want two products, one being present in 64% of orders and the other in 36% of them. We do the same with marketing UTM sources, payment methods, product service usages, etc…
class ShinyRockProvier(BaseProvider):
    def order(self, order_date):        return {            "user_id": uuid.uuid4().hex,            "order_id": uuid.uuid4().hex,            "order_date": order_date,            "product_id": int(select_string({"3": 0.64, "5": 0.36})),                        "utm_source": select_string({"_instagram": 0.2, "_amazon": 0.6, "_facebook": 0.1, "_youtube": 0.1})        }
    def payment(self, order_id, product_id, order_date):        return {            "payment_id": uuid.uuid4().hex,            "order_id": order_id,            "order_date": order_date,            "payment_method": select_string({"PAYPAL": 0.17, "CARD": 0.80, "APPLE_PAY": 0.03}),            "amount": product_id * 99        }
def service(self, user_id, product_id, run_date): return { "service_id": select_string({"MAPS": 0.3, "MUSIC": 0.4, "PHONE": 0.1, "MESSAGE": 0.2}), "user_id": user_id, "product_id": product_id, "duration": get_random_number(range_a=5, range_b=3600), "run_date": run_date }Then with Kestra we schedule a Flow to generate those data every day.
We first create a working directory to make every task accessing the same storage space. Then we start by cloning the shiny rocks GitHub repository and run the Python main program to generate data.
Note the {{ trigger.date ?? now() | date(“yyyy-MM-dd”)}}:
We declare a scheduling trigger every day with a backfill property allowing us to run the Flow over several past dates.
id: produce_datanamespace: shiny_rocks.analyticsdescription: |  This flow generate Shiny Rocks fictional data. Three datasets are created: `orders`, `payments` and `services`.  Like in reality, those data change everyday.
labels:  tag: producer
tasks:  - id: working_dir    type: io.kestra.plugin.core.flow.WorkingDirectory    tasks:
      - id: clone        type: io.kestra.plugin.git.Clone        url: https://github.com/kestra-io/shiny_rocks
      - id: python        type: io.kestra.plugin.scripts.python.Commands        warningOnStdErr: false        outputFiles:          - '*.csv'        beforeCommands:          - pip install -r scripts/produce/requirements.txt        commands:          - python scripts/produce/produce_data.py --date {{ trigger.date ?? now() | date("yyyy-MM-dd")}}
      - id: run_date        type: io.kestra.plugin.core.debug.Return        format: '{{ trigger.date ?? now() | date("yyyy-MM-dd")}}'

triggers: - id: schedule_every_day type: io.kestra.plugin.core.trigger.Schedule cron: "0 10 * * *" backfill: start: 2023-07-10T10:00:00ZOnce data are created we extract them in Google Cloud Storage and load them for further processing in Big Query. Note, this is just our choice for this demo. Kestra integrates with Snowflake, AWS Redshift, GCP BigQuery, Postgres, MySQL, DuckDB (MotherDuck) and many more.
id: load_orders_bigquerynamespace: shiny_rocks.analyticsdescription: |  When data are generated upstream, this flow ingest the `orders` data into Google Cloud Storage and BigQuery.
labels:  tag: load
inputs:  - id: orders_data    type: URI
  - id: order_date    type: DATE
tasks:
  - id: extract    type: io.kestra.plugin.gcp.gcs.Upload    serviceAccount: '{{ secret("gcp_creds") }}'    from: "{{ inputs.orders_data }}"    to: gs://shiny_rocks/app_log/orders/{{ inputs.order_date }}/orders.csv
  - id: load    type: io.kestra.plugin.gcp.bigquery.LoadFromGcs    from:      - "{{ outputs.extract.uri }}"    projectId: "kestra-dev"    destinationTable: "shiny_rocks.orders"    serviceAccount: '{{ secret("gcp_creds") }}'    format: CSV    autodetect: true    csvOptions:      fieldDelimiter: ","    timePartitioningField: "order_date"
triggers:
- id: get_data type: io.kestra.plugin.core.trigger.Flow inputs: orders_data: "{{ outputs.file_outputs.uris['orders.csv'] }}" order_date: "{{ outputs.run_date.value }}" conditions: - type: io.kestra.plugin.core.condition.ExecutionFlow namespace: shiny_rocks.analytics flowId: produce_data - type: io.kestra.plugin.core.condition.ExecutionStatus in: - SUCCESSHere the first task upload input CSV files coming from our previous Flow to Google Cloud Storage. Then we load this data into a BigQuery table. You can find more information about the secret function used in the above example in the dedicated documentation.
Shiny Rocks doesn’t just produce products; it also (fictionally) invests in marketing campaigns. Managed in a Google Spreadsheet, this data becomes integral when evaluating ROI. To ensure comprehensive analysis, we transfer this spreadsheet data into our primary data warehouse.
The following Flow directly reads the Google Spreadsheet and loads it into a proper BigQuery table.
id: marketing_investments_to_bigquerynamespace: shiny_rocks.analyticsdescription: |  The marketing teams manage their investments into a Google Spreadsheet, hence we load those data into BigQuery for further processing and join with other data.
labels:  tag: marketing
variables:  spreadsheet_id: 1C0UWuMuiEIxkOKzSQhbhFn6AILzmXX59NUbtI4s3wpU  dataset_table: shiny_rocks.marketing_investments
tasks:  - id: read_gsheet    type: io.kestra.plugin.googleworkspace.sheets.Read    description: Read data from Google Spreadsheet    serviceAccount: "{{ secret('gcp_creds') }}"    spreadsheetId: "{{ vars.spreadsheet_id }}"    store: true    valueRender: FORMATTED_VALUE
  - id: write_csv    type: io.kestra.plugin.serdes.csv.IonToCsv    description: Write CSV into Kestra internal storage    from: "{{ outputs.read_gsheet.uris.marketing }}"
  - id: load_biqquery    type: io.kestra.plugin.gcp.bigquery.Load    description: Load data into BigQuery    serviceAccount: "{{ secret('gcp_creds') }}"    autodetect: true    writeDisposition: WRITE_TRUNCATE    csvOptions:      fieldDelimiter: ","    projectId: kestra-dev    destinationTable: '{{ vars.dataset_table }}'    format: CSV    from: "{{ outputs.write_csv.uri }}"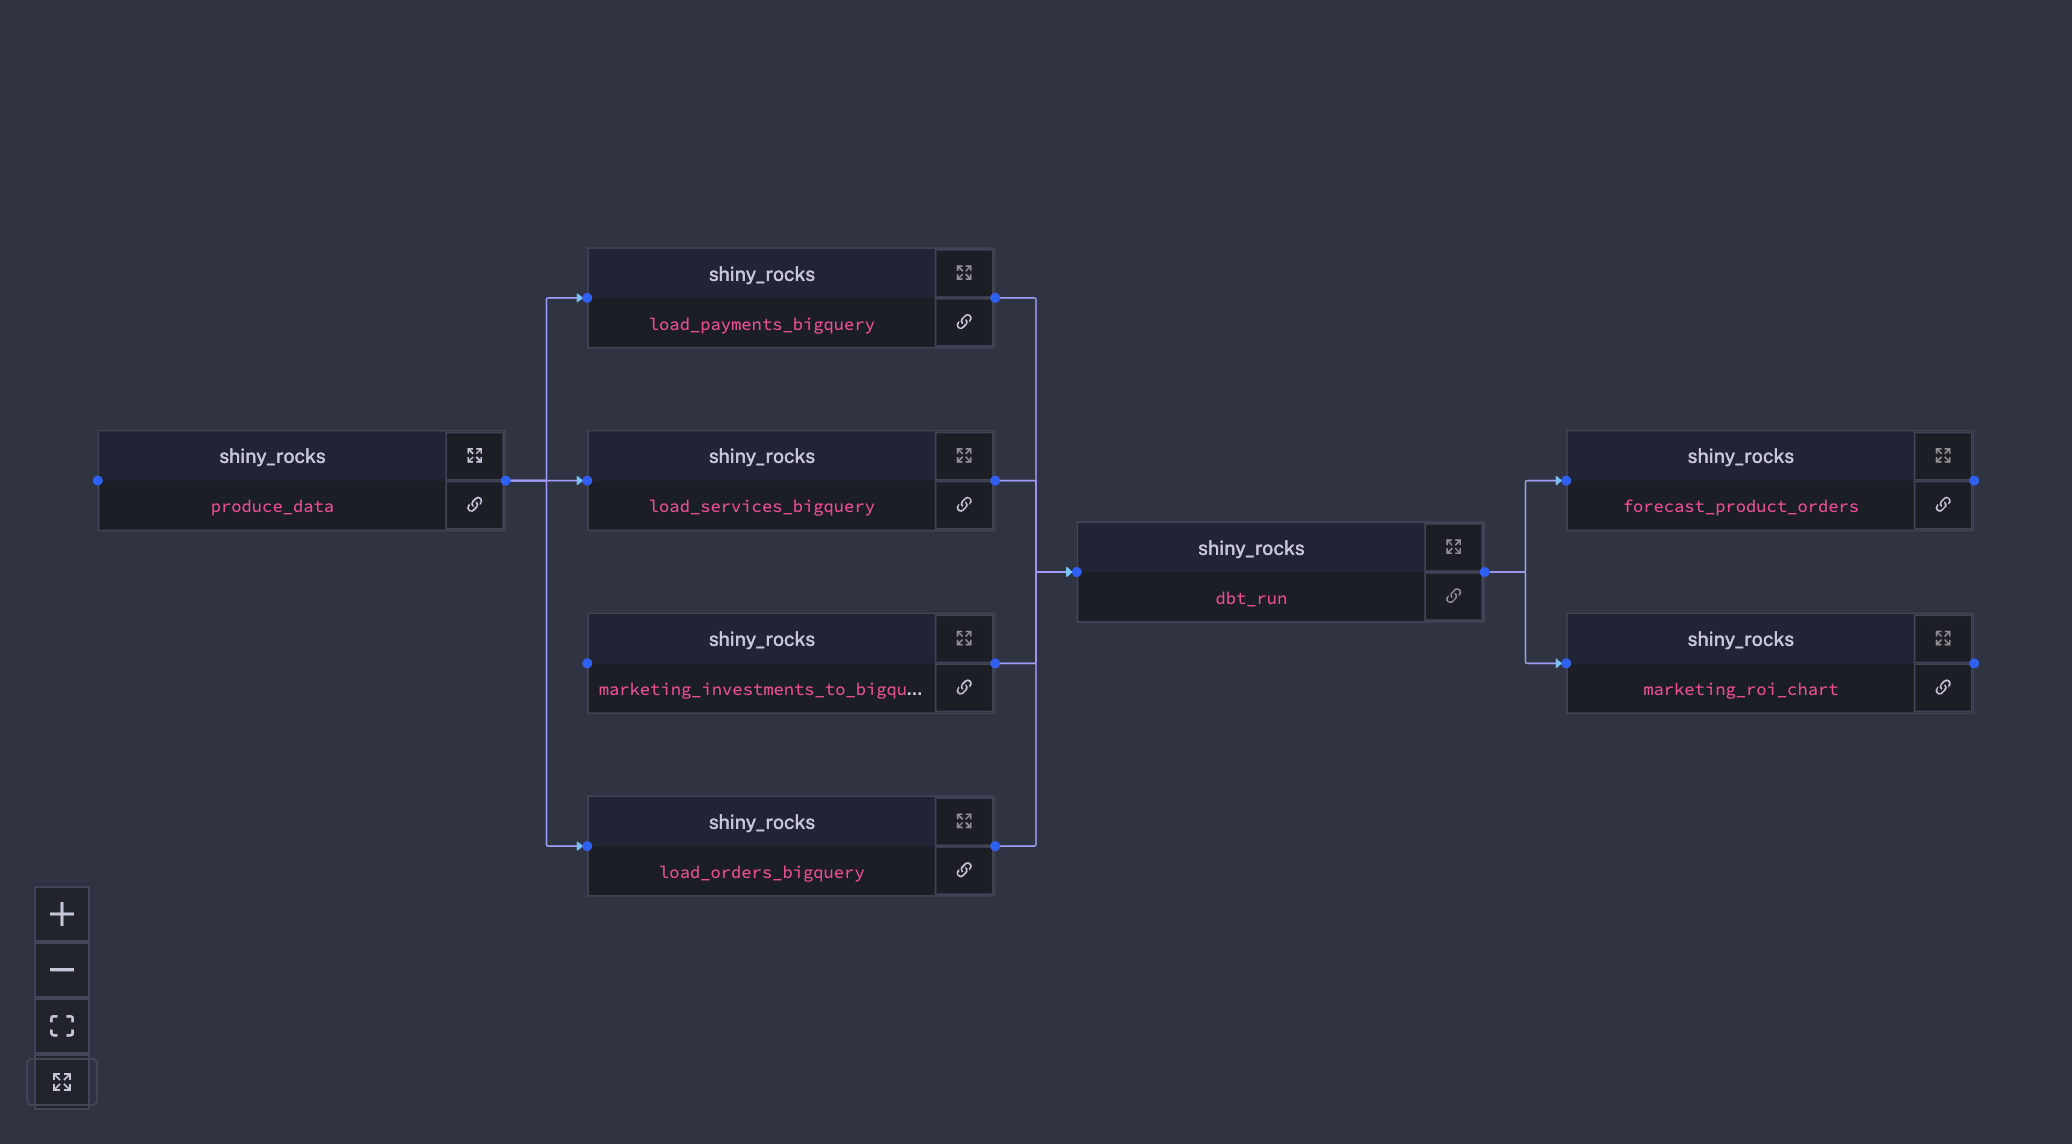
triggers: - id: schedule type: io.kestra.plugin.core.trigger.Schedule cron: "0 10 * * *When every data has been loaded into our data warehouse we trigger a dbt run to model our data. You can find the dbt project in the shiny rocks GitHub repository. We use the SIM data model (Staging, Intermediate, Mart, also known as the Medallion architecture) as explained in dbt documentation. This Flow is triggered when the three upstream dependencies are in success on the last running day.
id: dbt_runnamespace: shiny_rocks.analyticsdescription: |  Whenever all data are loaded in BigQuery, this flow will run a dbt job to transform data.
labels:  tag: analytics
tasks:  - id: workingdir    type: io.kestra.plugin.core.flow.WorkingDirectory    tasks:      - id: cloneRepository        type: io.kestra.plugin.git.Clone        url: https://github.com/kestra-io/shiny_rocks        branch: main
      - id: profile        type: io.kestra.plugin.core.storage.LocalFiles        inputs:          profiles.yml: |            shiny_rocks_dbt:              outputs:                dev:                  type: bigquery                  dataset: shiny_rocks                  fixed_retries: 1                  keyfile: service_account.json                  location: EU                  method: service-account                  priority: interactive                  project: kestra-dev                  threads: 8                  timeout_seconds: 300              target: dev          service_account.json: "{{ secret('gcp_creds') }}"

      - id: dbt        type: io.kestra.plugin.scripts.shell.Commands        docker:          image: ghcr.io/kestra-io/dbt-bigquery:latest        commands:          - dbt run --profiles-dir=. --project-dir=shiny_rocks_dbt
triggers: - id: multiple-listen-flow type: io.kestra.plugin.core.trigger.Flow conditions: - type: io.kestra.plugin.core.condition.ExecutionStatus in: - SUCCESS - id: multiple type: io.kestra.plugin.core.condition.MultipleCondition window: P1D windowAdvance: P0D conditions: orders: type: io.kestra.plugin.core.condition.ExecutionFlow namespace: shiny_rocks.analytics flowId: load_orders_bigquery payments: type: io.kestra.plugin.core.condition.ExecutionFlow namespace: shiny_rocks.analytics flowId: load_payments_bigquery services: type: io.kestra.plugin.core.condition.ExecutionFlow namespace: shiny_rocks.analytics flowId: load_services_bigquery marketing_investments: type: io.kestra.plugin.core.condition.ExecutionFlow namespace: shiny_rocks.analytics flowId: marketing_investments_to_bigqueryThe marketing team wants to know how much their ad campaigns drive sales or not. They asked the data team for a daily report showing the ROI of each platform.
To do so, data-engineers created a Kestra Flow that: Retrieves data from the mart table in BigQuery, merging sales and marketing investment insights. Run a python script generating a chart. Delivers this chart via email to the marketing team, ensuring they’re always updated on campaign performances.
id: marketing_roi_chartnamespace: shiny_rocks.analyticsdescription: |  After dbt transformation, we use marketing data joined to orders to create a plot of marketing ROI.  The flow first query data from BigQuery and then run a Python script to read data and create a chart out of it.  Then it sends this chart by email to the marketing team.
labels:  tag: marketing
tasks:  - id: get_data    type: io.kestra.plugin.gcp.bigquery.Query    serviceAccount: '{{ secret("gcp_creds") }}'    projectId: kestra-dev    sql: |      SELECT        platform,        marketing_cost,        sales_amount,        marketing_roi      FROM shiny_rocks.mart_marketing_vs_sales      WHERE date = DATE_ADD("{{ trigger.date ?? now() | date(format='YYYY-MM-dd') }}", INTERVAL -3 DAY)    store: true

  - id: to_csv    type: io.kestra.plugin.serdes.csv.IonToCsv    from: "{{ outputs.get_data.uri }}"

  - id: working_dir    type: io.kestra.plugin.core.flow.WorkingDirectory    tasks:
      - id: files        type: io.kestra.plugin.core.storage.LocalFiles        inputs:          data.csv : "{{ outputs.to_csv.uri }}"
      - id: python        type: io.kestra.plugin.scripts.python.Script        warningOnStdErr: false        docker:          image: ghcr.io/kestra-io/pydata        beforeCommands:          - pip install plotnine        script: |          import pandas as pd          from plotnine import ggplot, geom_col, aes, ggsave
          data = pd.read_csv("data.csv")          plot = (            ggplot(data) +            geom_col(aes(x="platform", fill="platform", y="marketing_cost"))          )          ggsave(plot, "plot.png")
      - id: output        type: io.kestra.plugin.core.storage.LocalFiles        outputs:          - plot.png
  - id: send_email    disabled: true    type: io.kestra.plugin.email.MailSend    attachments:      - name: plot.png        uri: '{{ outputs.output["plot.png"] }}'    subject: "Daily marketing ROI"    to: "marketing@shinyrocks.com"    htmlTextContent: |      Here is the last marketing ROI data!

triggers:
- id: get_data type: io.kestra.plugin.core.trigger.Flow conditions: - type: io.kestra.plugin.core.condition.ExecutionFlow namespace: shiny_rocks.analytics flowId: dbt_run - type: io.kestra.plugin.core.condition.ExecutionStatus in: - SUCCESSFor those who wish to dive deeper, we have made the entire Shiny Rocks project available for your exploration and usage.
Feel free to access the data and use it as a base for your projects or demos. These “plausible” datasets can be invaluable for learning, testing, and showcasing various tools and concepts. You can also look at our live demo where you could find all Flow showcased here running everyday in the shiny_rocks namespace.
Stay tuned, as Shiny Rocks will make appearances in some of our future posts, giving you even more real-world-like scenarios to delve into with Kestra.

Stay up to date with the latest features and changes to Kestra