Authors
Anna Geller
Anna Geller
We’re excited to announce Kestra 0.11.0, which includes a redesigned topology view. We’ve introduced outputs preview, caching, dynamic webhooks, and a new Administration UI to help you troubleshoot event-driven workflows.
Along with this release, we’ve published the official Visual Studio Code extension offering autocompletion and syntax validation for local development. You can now create and deploy complex workflows directly from your local VS Code IDE without ever having to open the UI.
This release also makes Kestra easier to use for Command Line enthusiasts. We’ve added new integrations to automate tasks on AWS, Google Cloud, Azure, dbt, and Spark using dedicated CLI tasks.
The Databricks and AWS Athena integrations help orchestrate and manage data lake(house)s, and the script plugin now also supports Julia.
This release adds a Hightouch plugin, a Telegram notification task, Singer Taps for Oracle and Microsoft SQL Server, and GCP tasks to declaratively interact with Google’s PaLM 2 Large Language Models.
Lastly, we’ve introduced several performance, documentation, and usability enhancements.
Let’s dive into the highlights of this release.
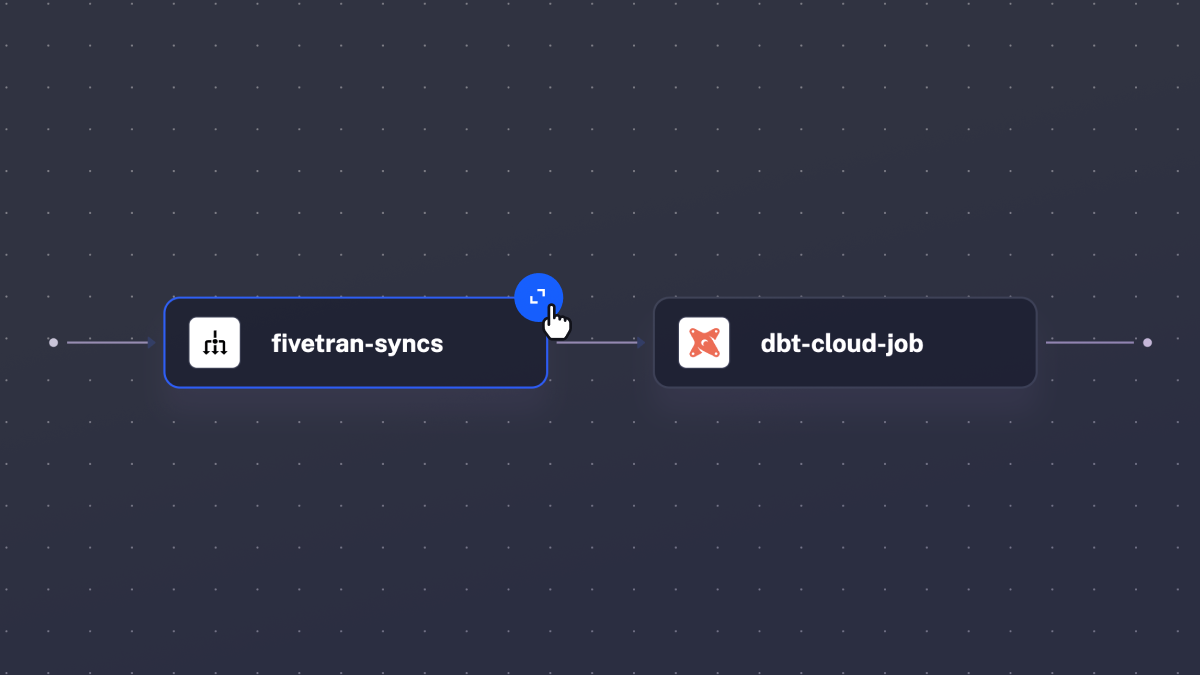
The flagship feature of this release is the fully redesigned Topology view. Your data pipelines and process flows are now more visually appealing and, at the same time, more powerful than ever before. You can expand and collapse any group of tasks, including parallel and sequential task groups, working directories, lists of triggers, conditional branches, and more, helping you navigate complex workflows by drilling down to details and zooming out to see a bigger picture.
Here is what the new topology view looks like:
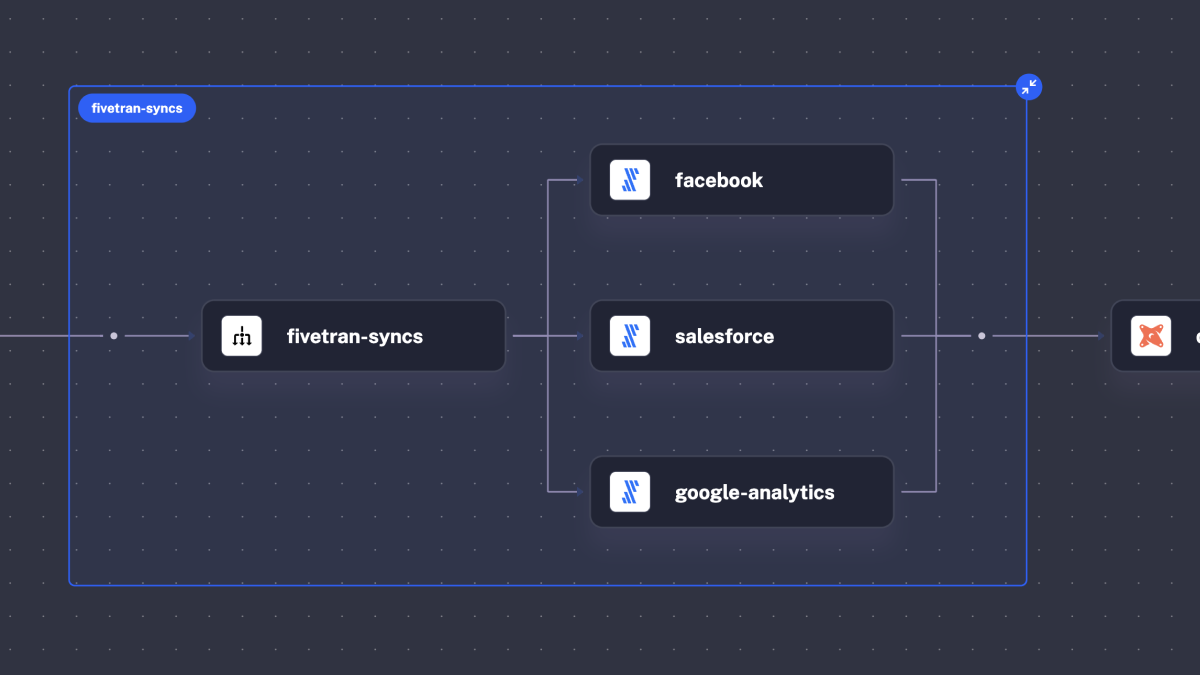
And here is the same flow when you expand the Parallel task group:
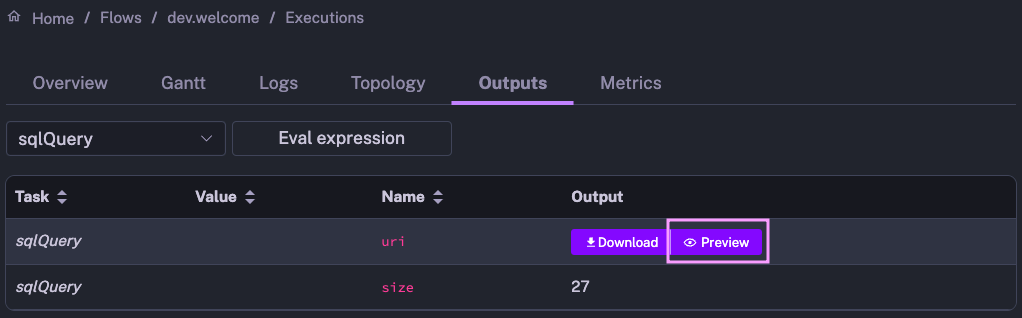
When you navigate complex workflows that produce specific outputs, it’s useful to see the result of each process. The new Outputs Preview feature allows you to view API payloads, tables, plots, and much more.
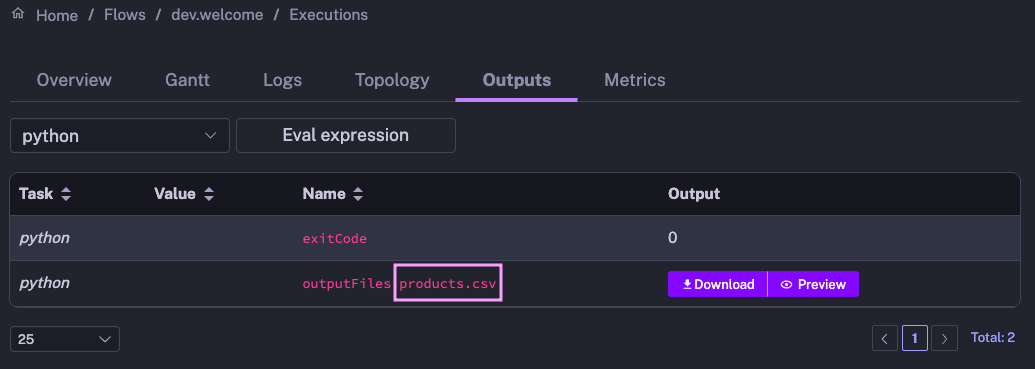
How does it work? Once your flow finishes running, navigate to the Outputs tab on the Execution page. Then, click on the “Preview” icon of any Kestra output to see the result of any task that produces a file. This feature is available across a wide variety of file formats, including ION, CSV, JSON, PNG, and JPG, as well as text and markdown files.
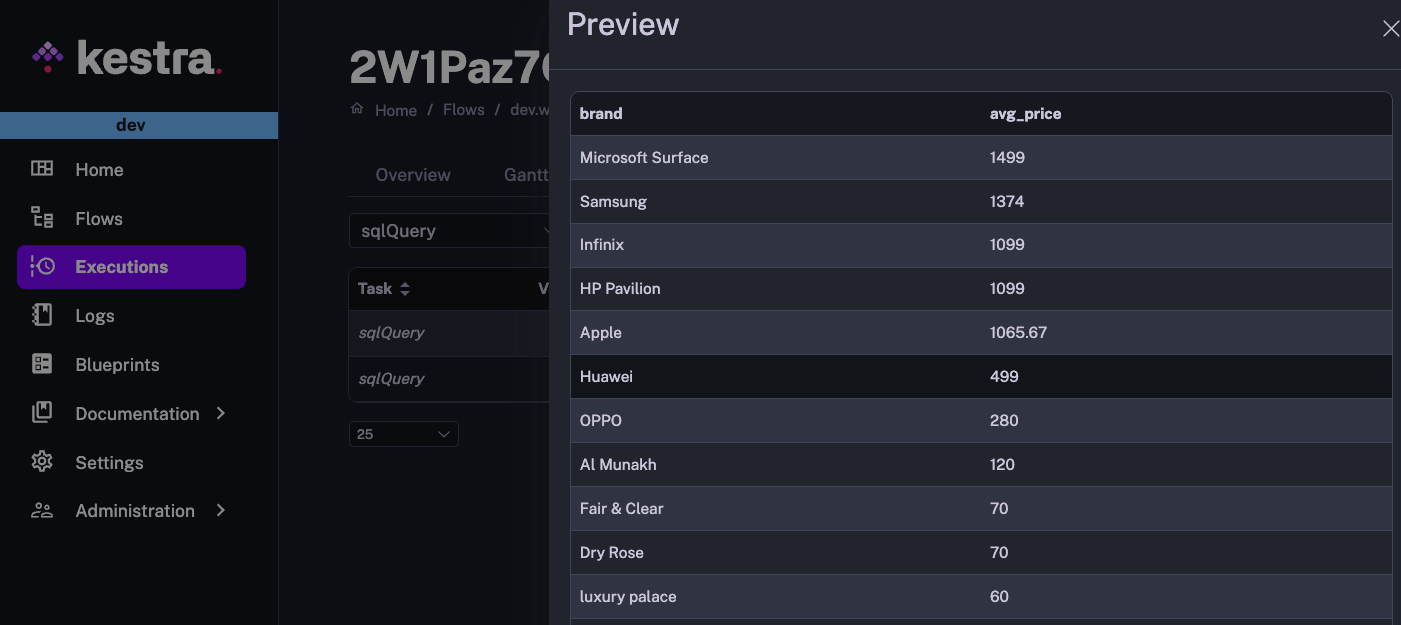
Here is an example of a Query task returning output results, serialized in Amazon ION format, which Kestra renders as a table:
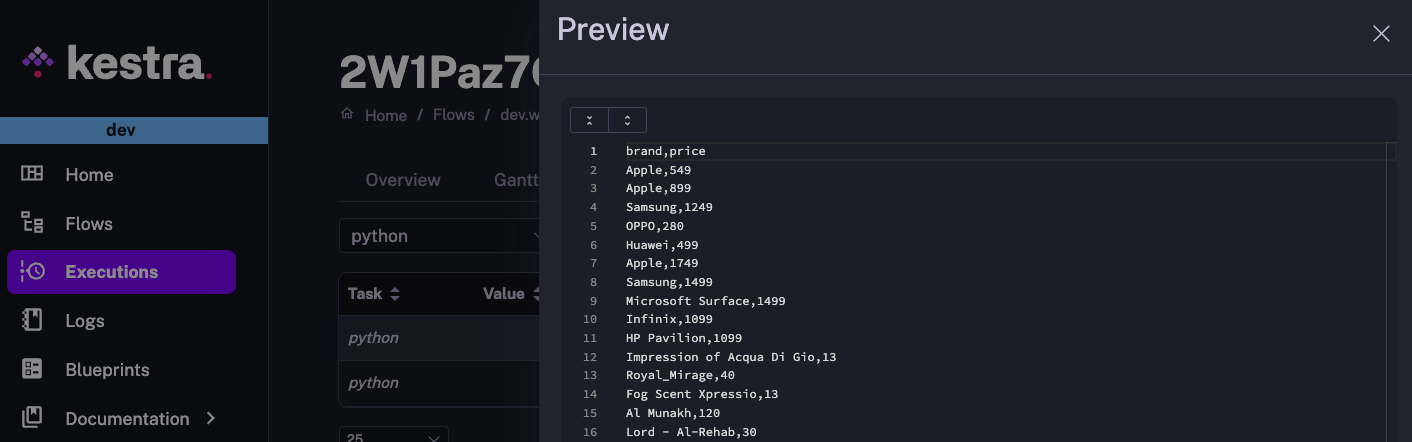
And here is a preview of a CSV file products.csv, returned by a Python task:
Finally, here is a simple flow example rendering a markdown file:
id: release_postnamespace: company.team
tasks:  - id: render_markdown    type: io.kestra.core.tasks.storages.LocalFiles    inputs:      myfile.md: |        ### Welcome to Kestra 0.11.0 ✨
        Kestra `0.11.0` includes:        - a **redesigned topology view**        - and this *beautiful* **outputs preview** you see now.    outputs:      - "*.md"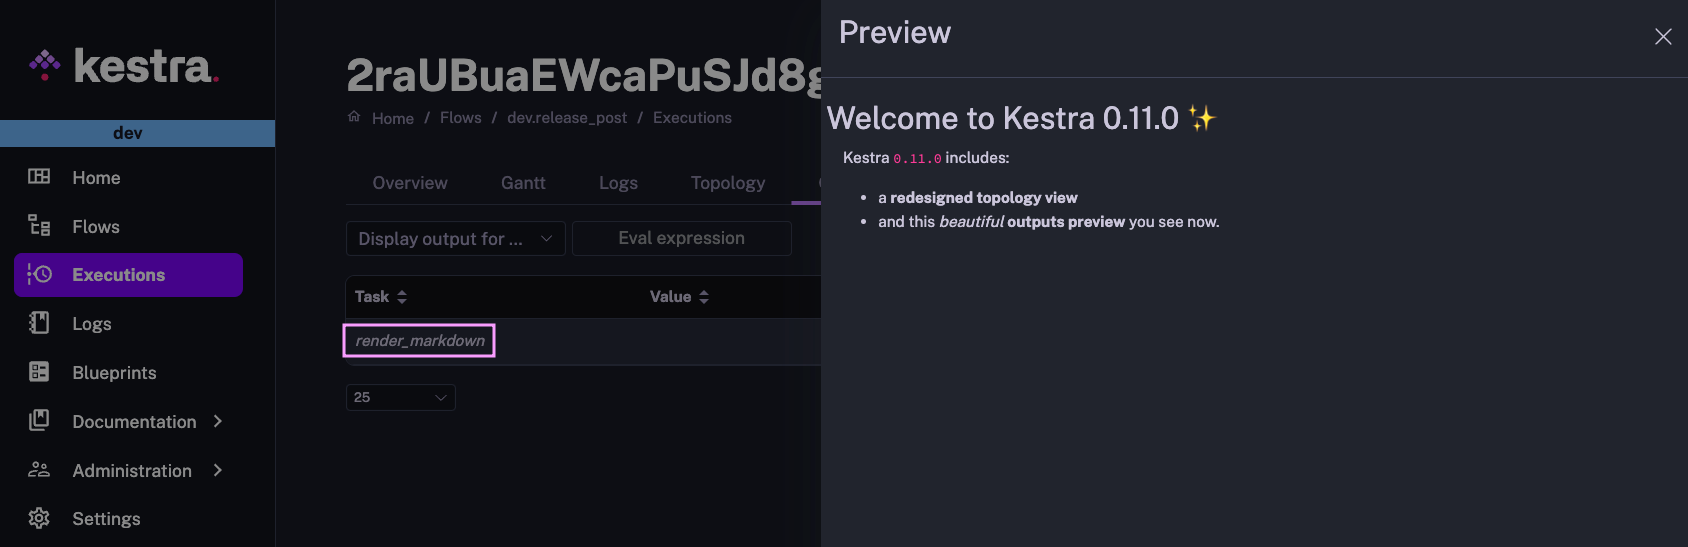
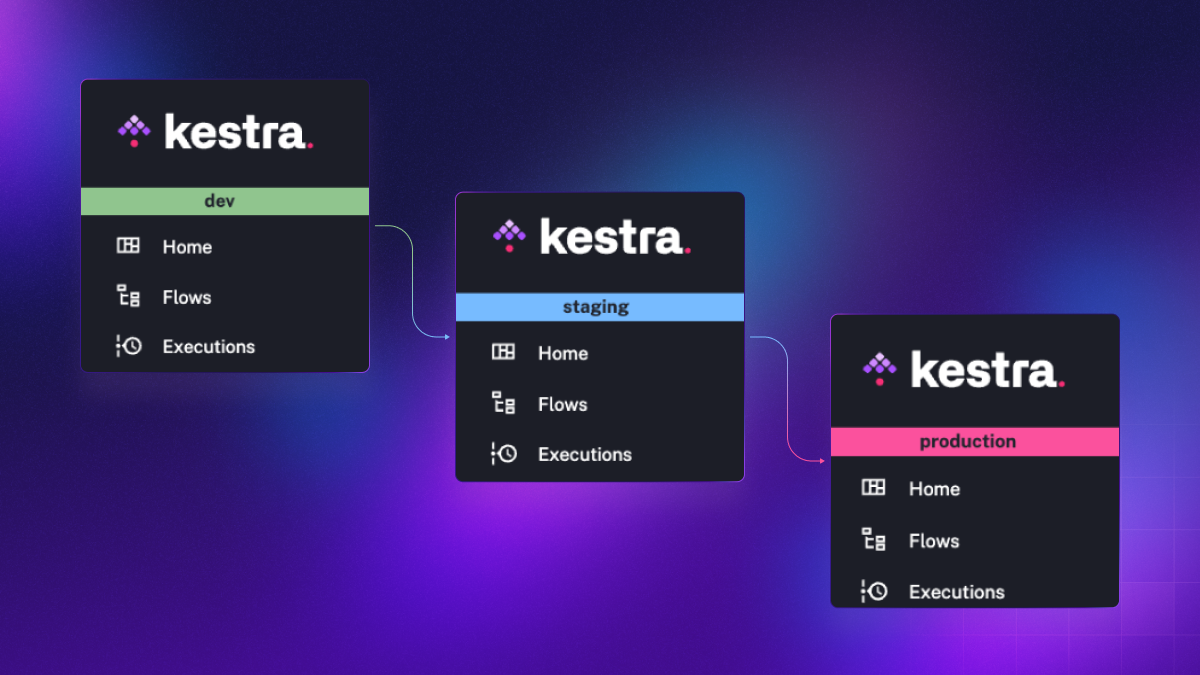
While Kestra allows you to use namespaces to separate environments, most of our users deploy dedicated instances for development, staging, and production. This release introduces a UI setting to easily distinguish between environments.
Inspired by Gunnar Morling’s excellent blog post “Oh… This is Prod?!”, you can now optionally set a custom environment name and color in the top bar in the UI. Simply go to Settings and from there, set the desired environment name and color.
Big thanks to the community member, yuri, for contributing this feature!
Additionally, the Settings page now allows you to customize the type and size of the font for the code editor.
We believe that the code editor, embedded within the Kestra UI, is the easiest way to create complex workflows. It provides autocompletion, syntax validation, a live-updating topology view, built-in documentation and example workflows provided as blueprints.
However, we know that many of you would love to use a local IDE to write flows along with your custom applications that you want to orchestrate incl. microservices, Python, R, Julia, or Node.js scripts as well as SQL queries. We’re working on further enhancing that local development experience. Today, we’re thrilled to announce the first step on that journey — our official Visual Studio Code extension.
The VS Code extension provides autocompletion and syntax validation so that you can easily write Kestra workflow code without opening the UI.
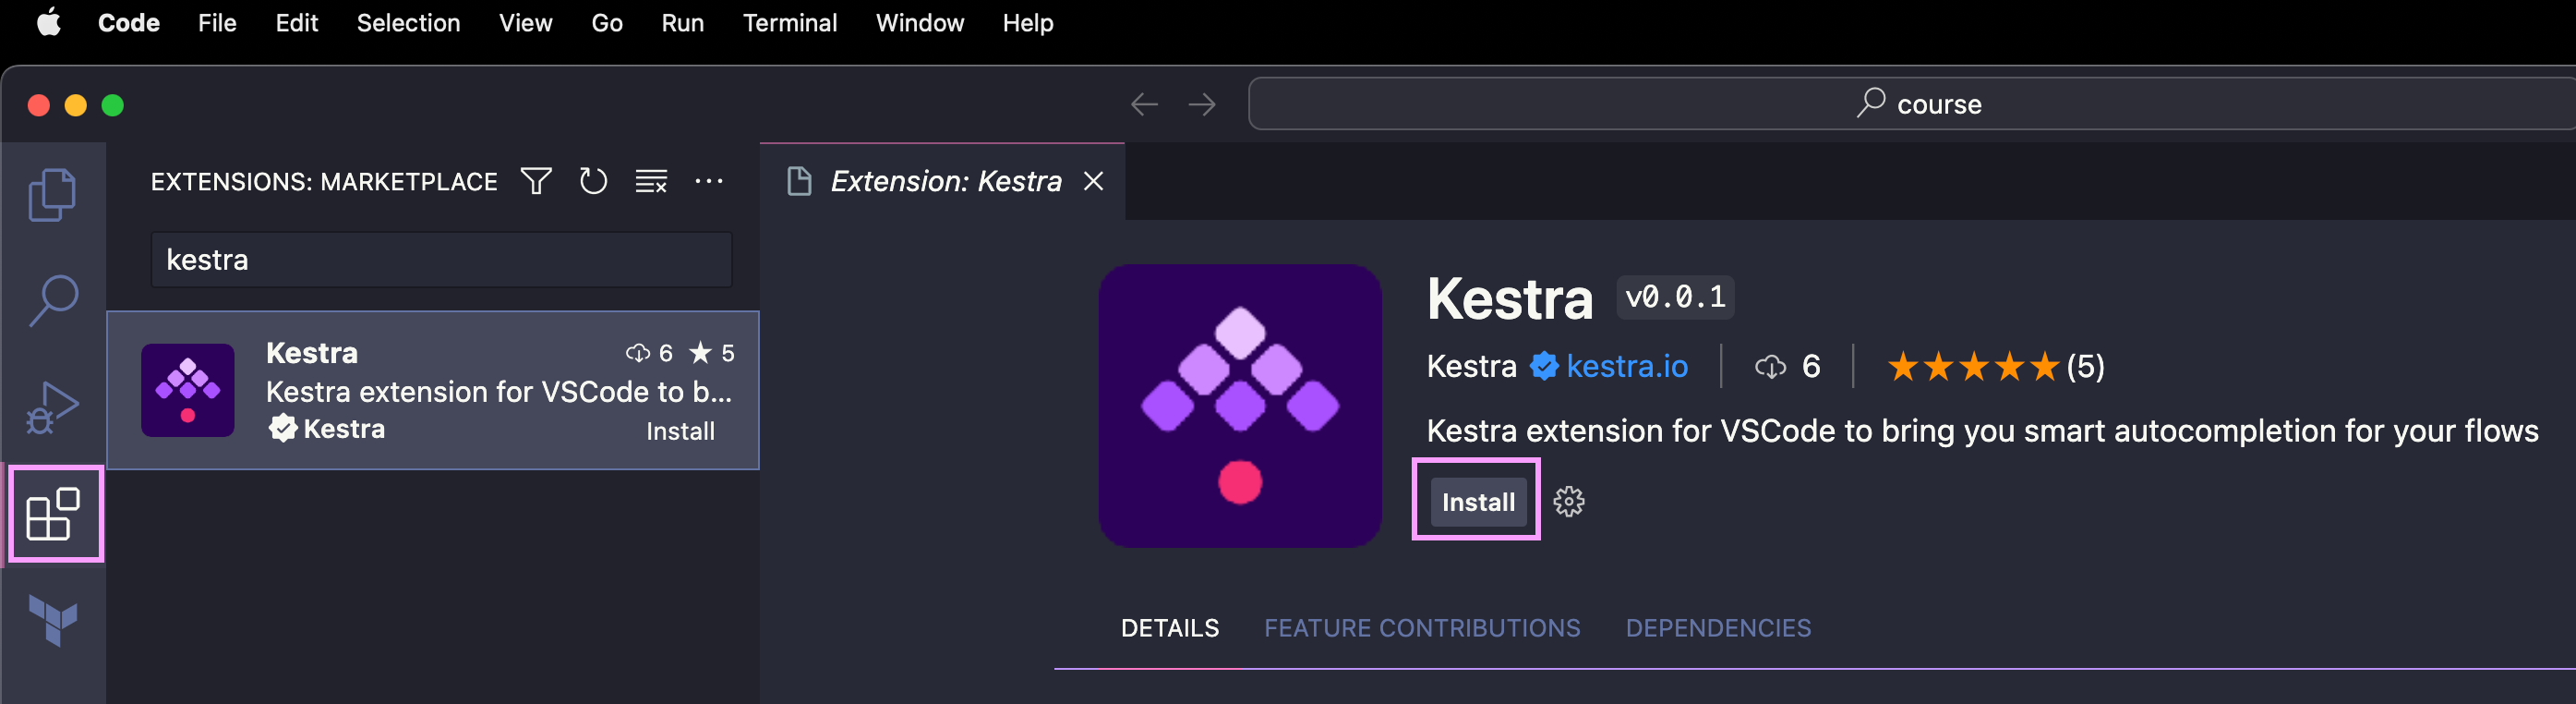
First, install the extension by searching for “Kestra” in the VS Code extensions marketplace or using the following marketplace link.
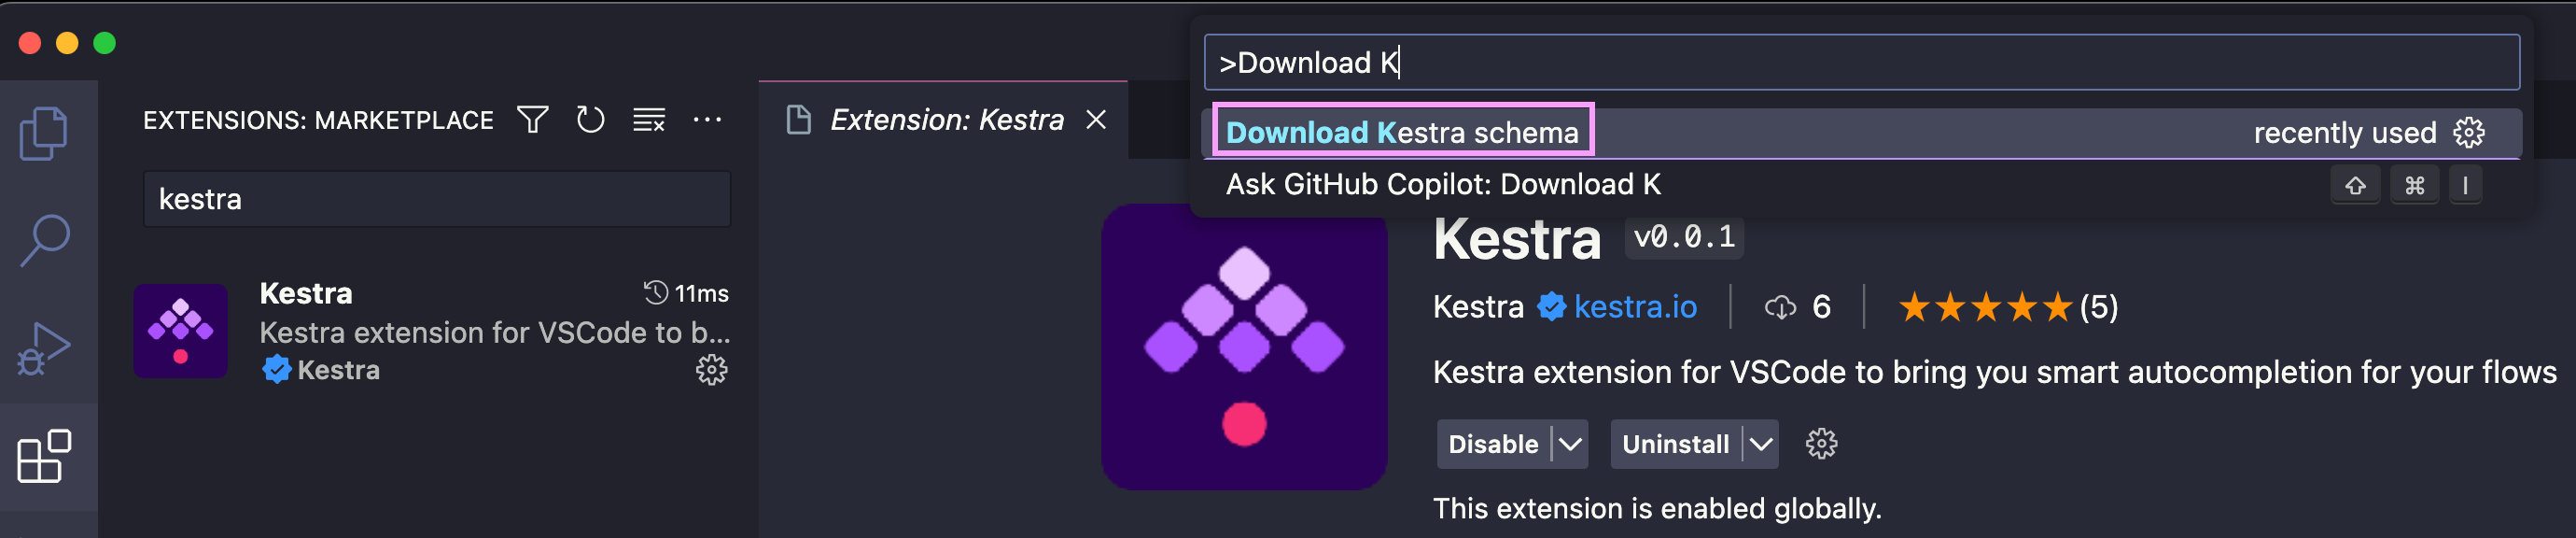
After installing the extension, press Command/Ctrl + Shift + P in VS Code to navigate to the Command Palette. Start typing the command called “Download Kestra schema” and paste the endpoint of your Kestra’s instance.
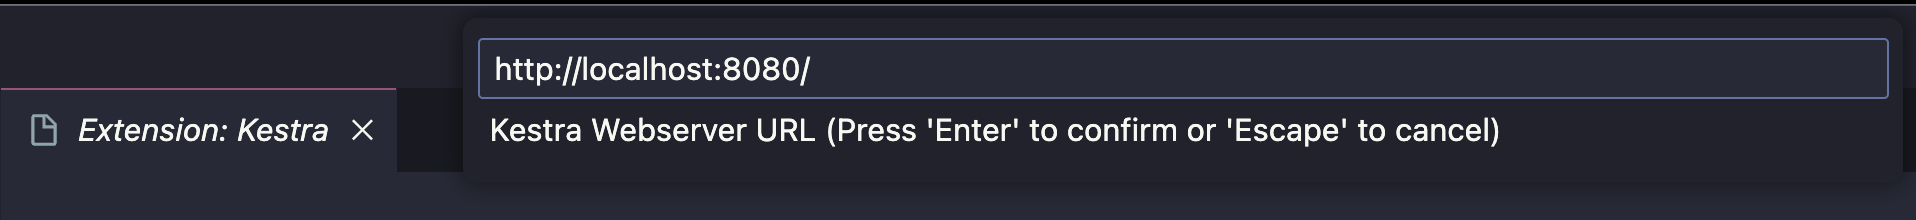
If you use the open-source version running locally, type: http://localhost:8080/ and hit Enter.
If your instance is secured with some authentication mechanism (e.g. basic auth), you’ll be prompted to enter credentials.
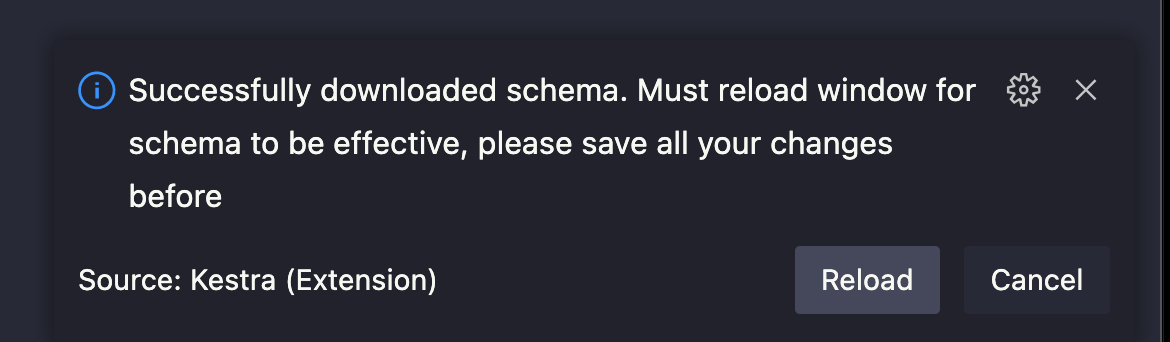
You should then see a notification that the schema has been downloaded, requesting you to save your work and reload the VS Code window.
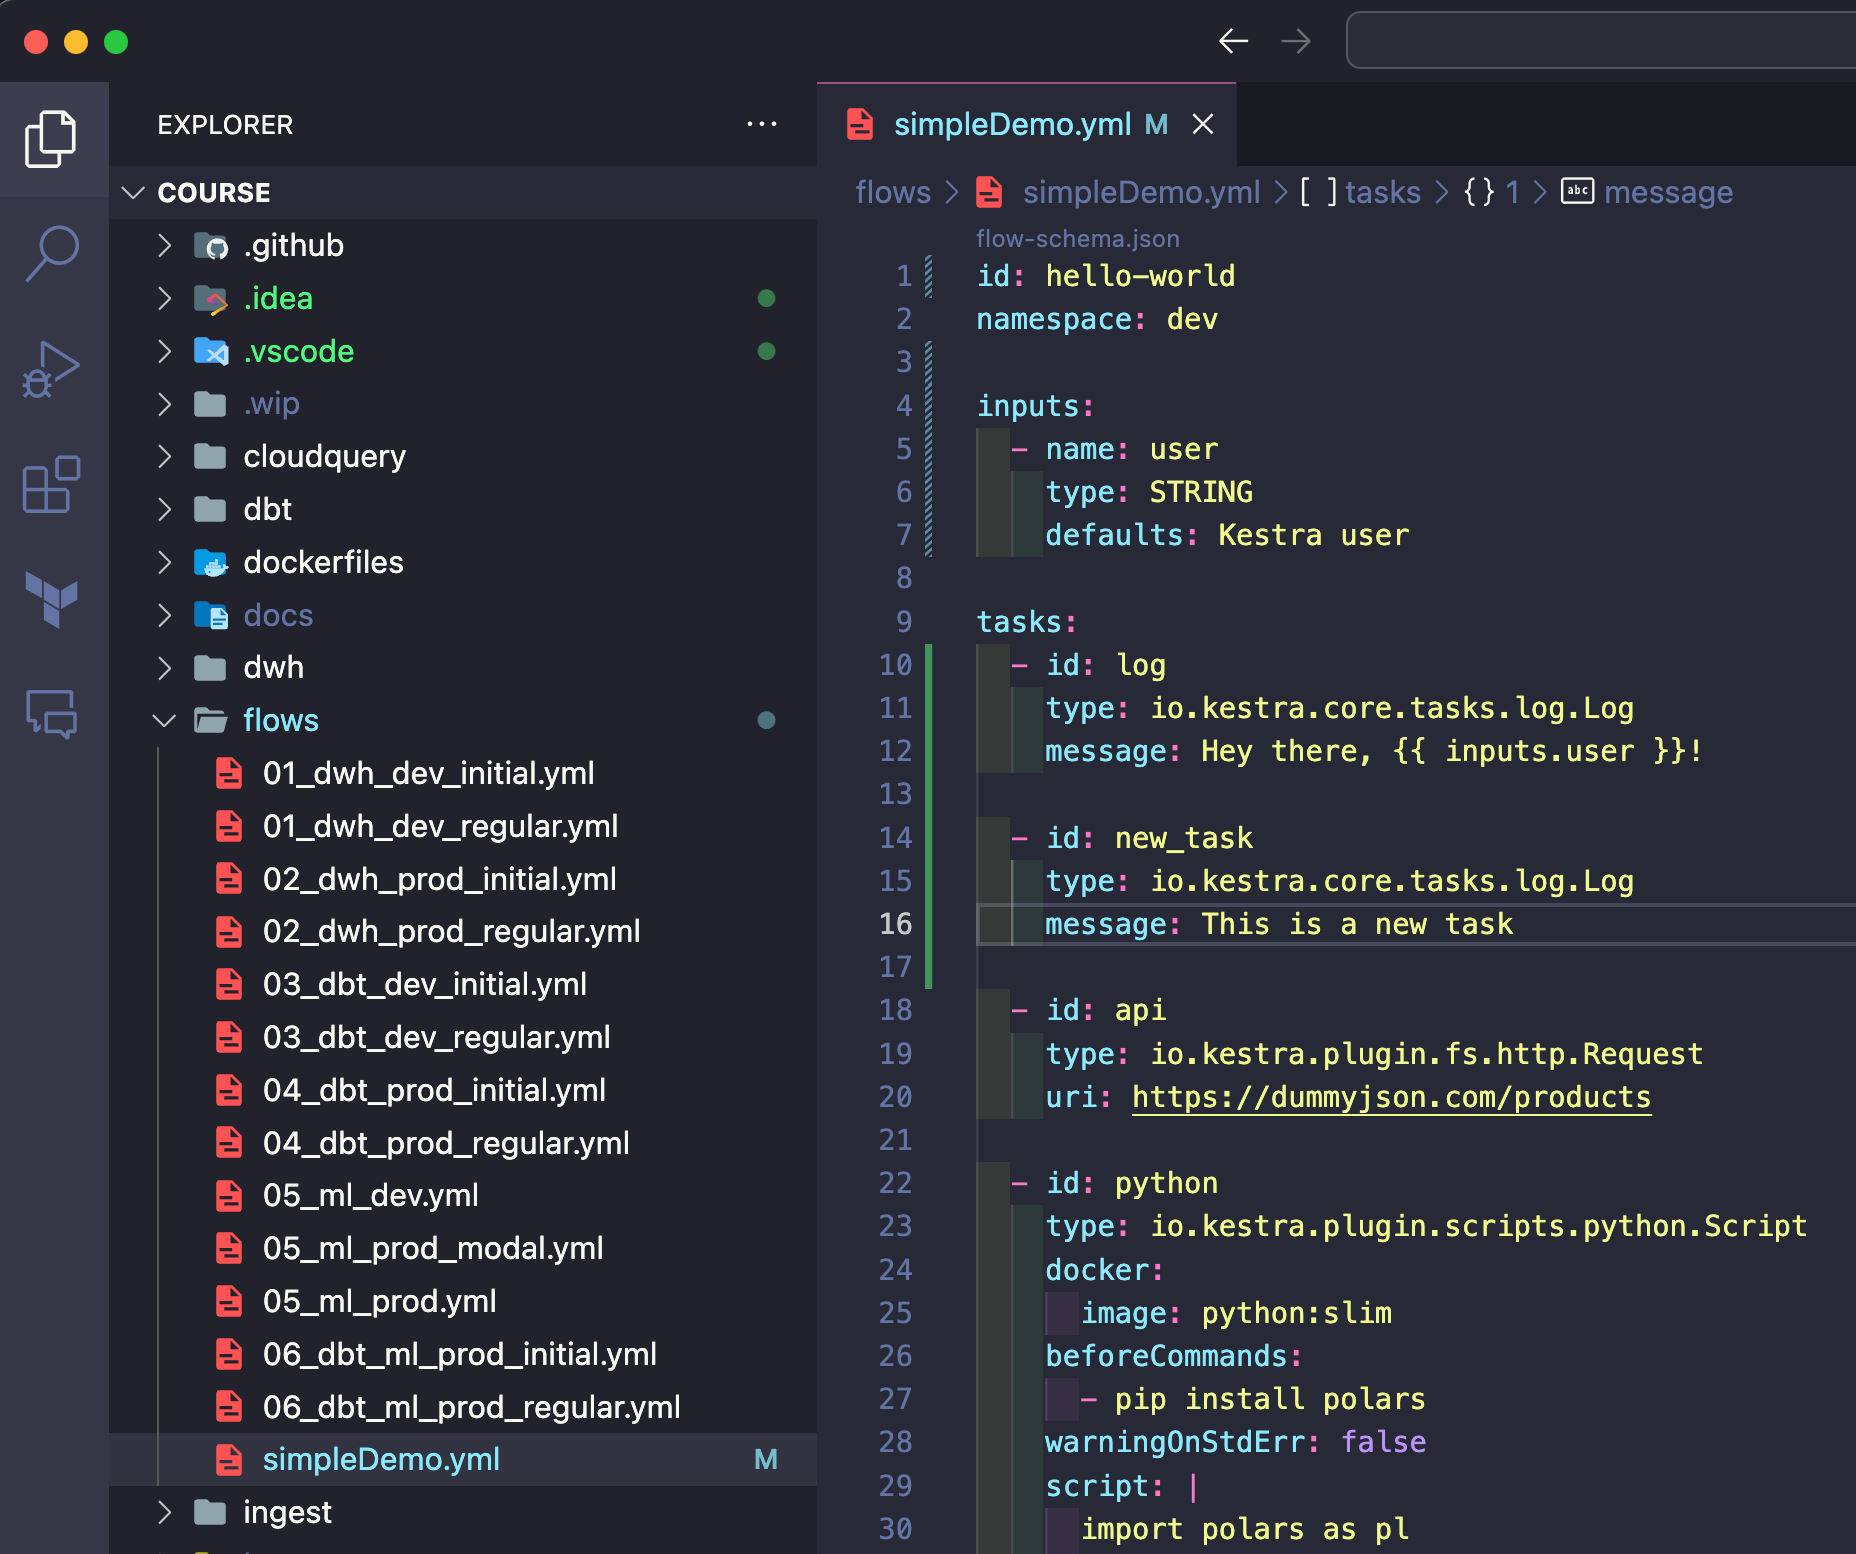
After reloading the window, you can open a Kestra flow file (or create a new YAML file) and use the Control + Space command to get autocompletion.
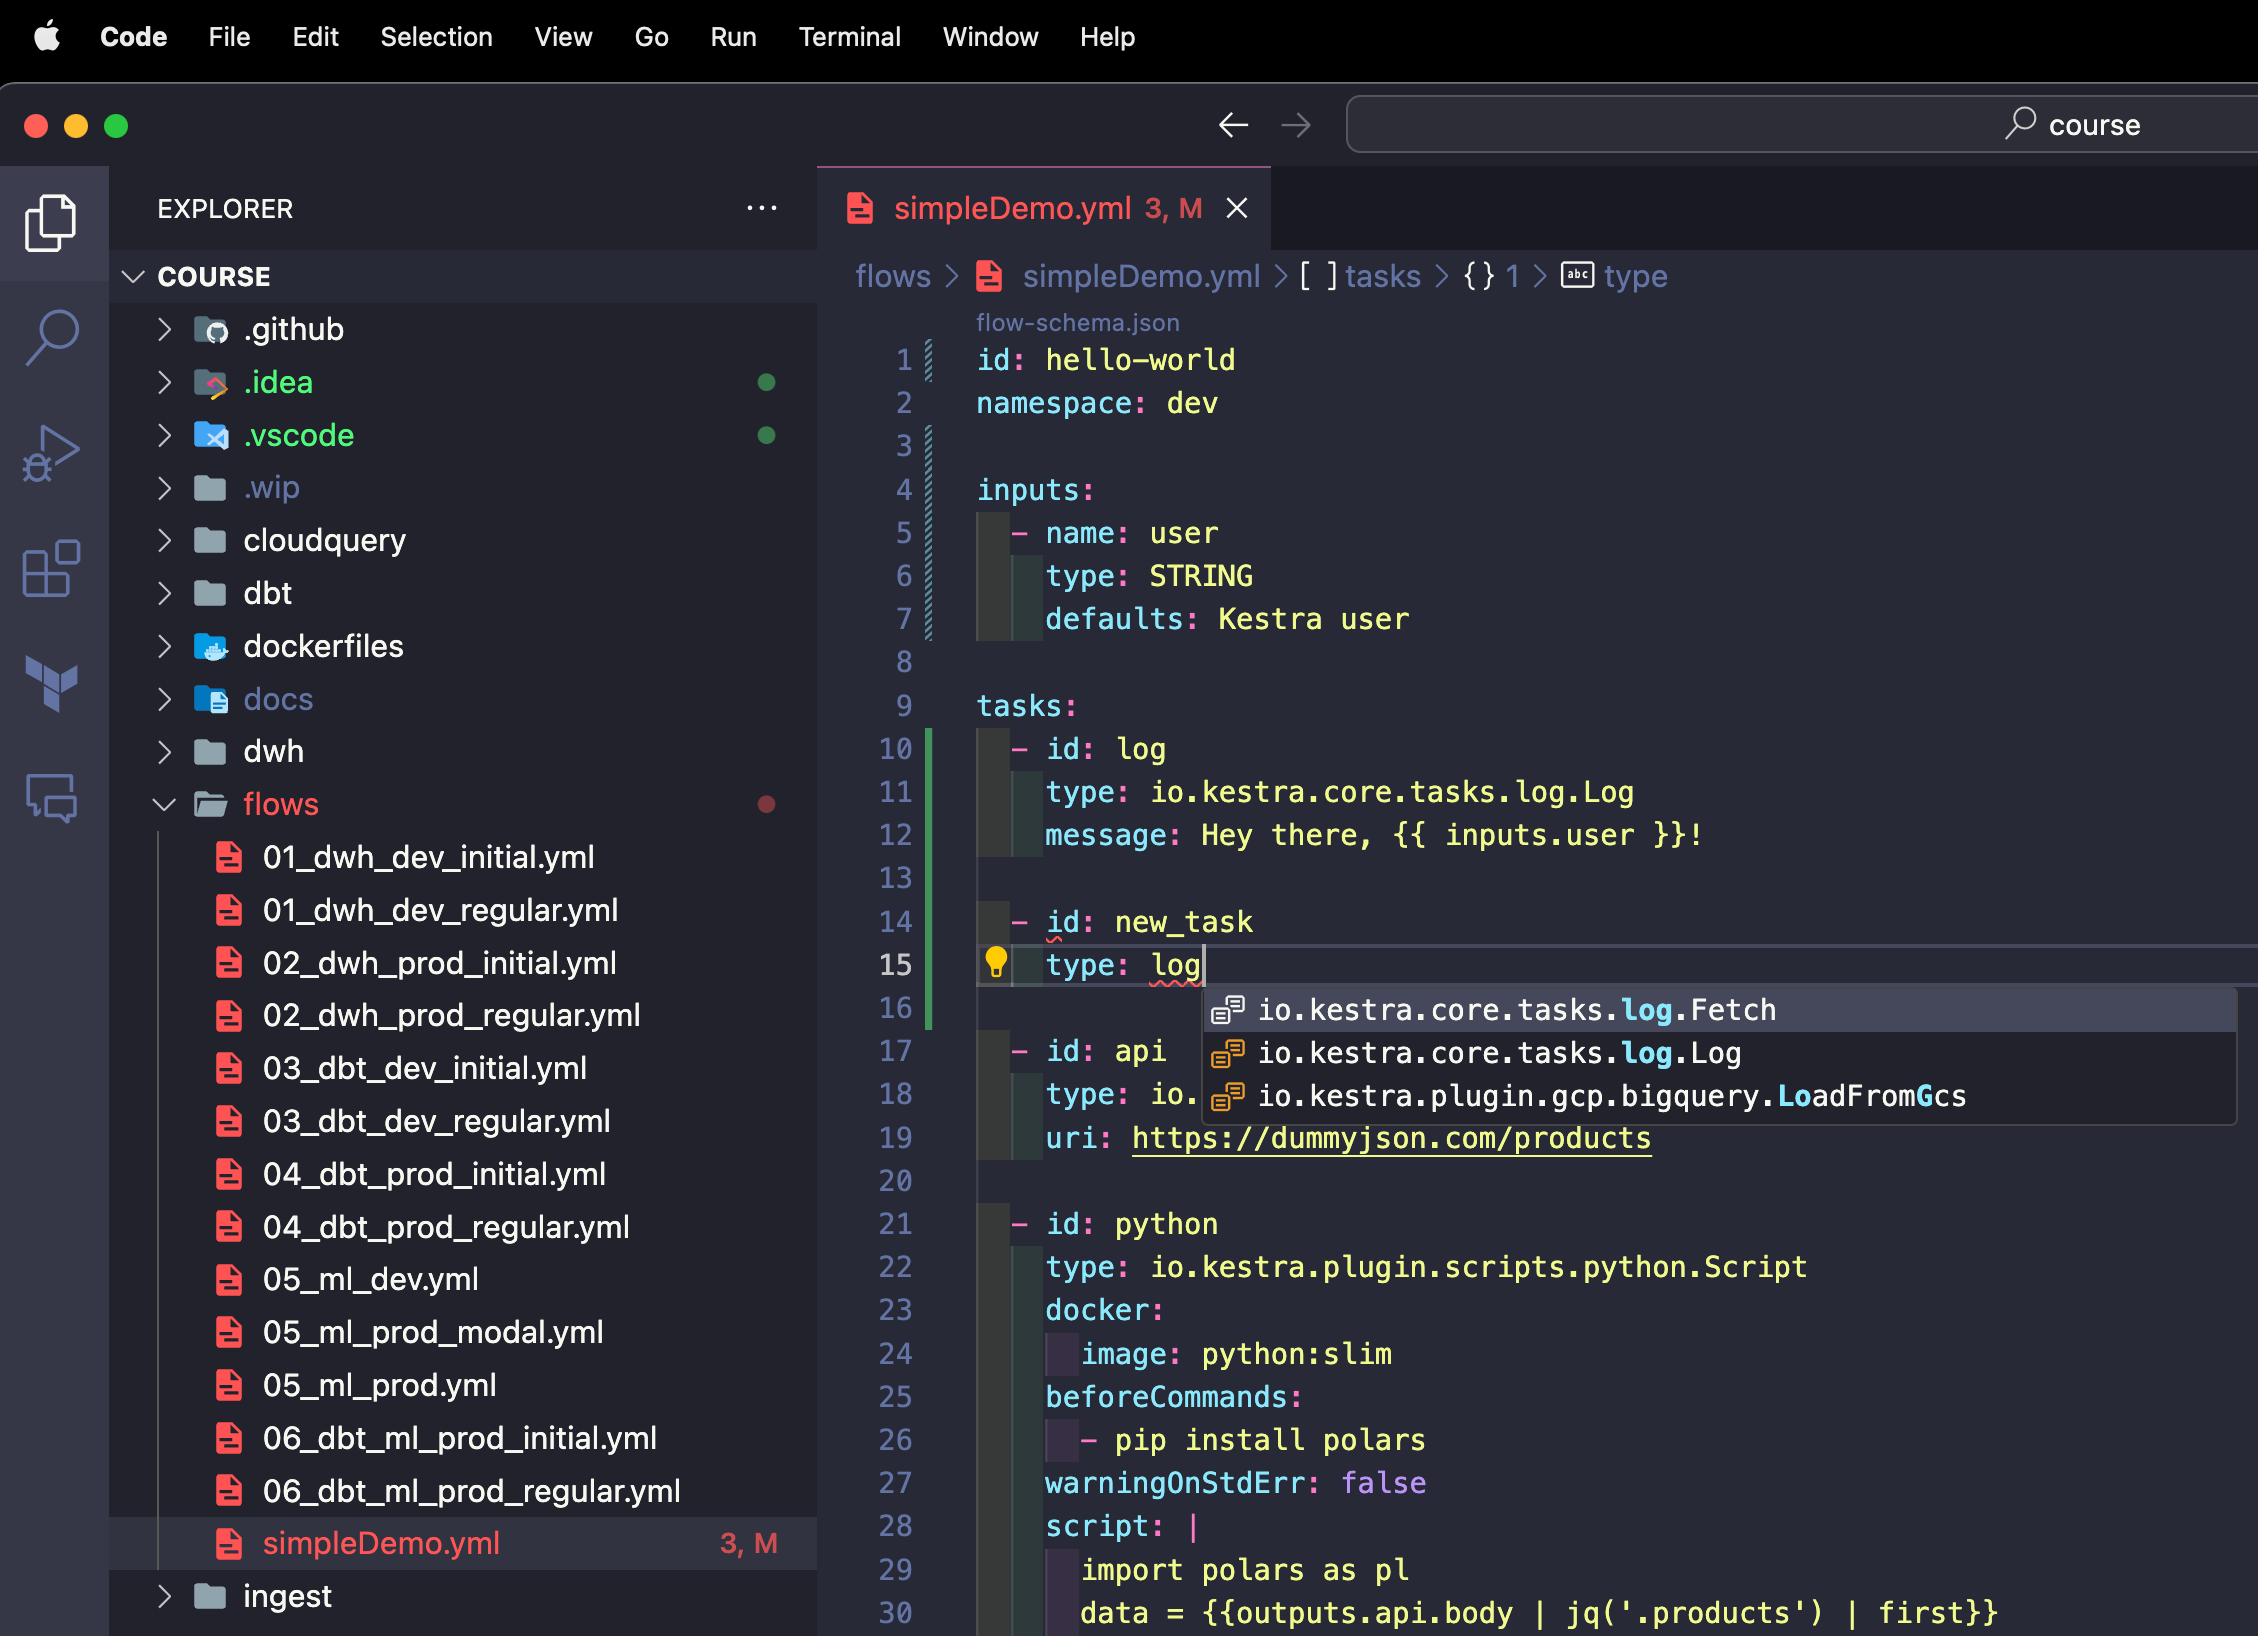
Note how flows that don’t pass the syntax validation are marked red. As soon as we fix the syntax error, the red underlines disappear.
The VS Code extension can make CI/CD and infrastructure build pipelines easier:
The VS Code extension is just the first step to better support the local development of workflow code along with your business and application logic. In the upcoming releases, we’ll further simplify syncing local files to Kestra, even without Git and CI/CD.
From this release on, you can set a secret or environment variable name and that value will be dynamically rendered. The expression {{ secret('KESTRA_WEBHOOK_KEY') }} will fetch the value of the secret KESTRA_WEBHOOK_KEY so that you don’t have to use hardcoded webhook keys. You can now easily rotate such sensitive values without having to change anything in your flow code.
id: webhooknamespace: company.team
tasks:  - id: message    type: io.kestra.core.tasks.log.Log    message: Hi from a flow triggered by a webhook!
triggers:  - id: captain-hook    type: io.kestra.core.models.triggers.types.Webhook    key: "{{ secret('KESTRA_WEBHOOK_KEY') }}"
Because of that dynamicism, we no longer auto-generate webhook keys. You must provide a key when creating a webhook trigger to ensure that the webhook definition remains fully declarative. With that change, the webhook trigger is now defined and managed entirely from the YAML flow configuration, true to the philosophy of Infrastructure as Code.
If you have existing webhook triggers, make sure to explicitly set a webhook key before upgrading to Kestra 0.11.0. We recommend using a secret or an environment variable.
The webhook URL stays the same as before by following the format https://your_kestra_hostname/api/v1/executions/webhook/{namespace}/{flowId}/{key}. The only difference is that from this release on, the webhook key can be dynamically rendered from secrets or environment variables.
If you’ve used GitHub Actions before, the new Caching feature in Kestra will look familiar. It allows you to cache a subset of files to speed up your workflow execution. This is especially useful when you work with sizeable package dependencies that don’t change often.
For instance, you may want to install some Python or Node.js packages before running your script. You can now cache the node_modules or Python venv folder to avoid re-installing the dependencies on each run.
To do that, add a cache to your WorkingDirectory task. The cache property accepts a list of glob patterns to match files to cache. The cache will be automatically invalidated after a specified time-to-live using the ttl property accepting a duration.
How does it work under the hood? Kestra packages the files that need to be cached and stores them in the internal storage. When the task is executed again, the cached files are retrieved, initializing the working directory with their contents.
id: node_cached_dependenciesnamespace: company.team
tasks:  - id: working_dir    type: io.kestra.core.tasks.flows.WorkingDirectory    cache:      patterns:        - node_modules/**      ttl: PT1H    tasks:    - id: node_script      type: io.kestra.plugin.scripts.node.Script      beforeCommands:        - npm install colors      script: |        const colors = require("colors");        console.log(colors.red("Hello"));
What about cache invalidation? Here’s how that works:
ttl didn’t pass, the files are retrieved from cachettl passed, the cache is invalidated and no files will be retrieved from cache; because cache is no longer present, the npm install command from the beforeCommands property will take a bit longer to executettl to:
PT5H — the files will be cached for five hours using the new ttl durationPT5M — the cache will be invalidated after five minutes using the new ttl duration.The ttl is evaluated at runtime. If the most recently set ttl duration has passed as compared to the last task run execution date, the cache is invalidated and the files are no longer retrieved from cache.
As Werner Vogels, Amazon’s CTO, once said: “Everything fails all the time”. External systems can experience outages and some processes might be stuck. That’s why this release introduces a new Administration section, including a Triggers page that can help you troubleshoot event-driven workflows when needed.
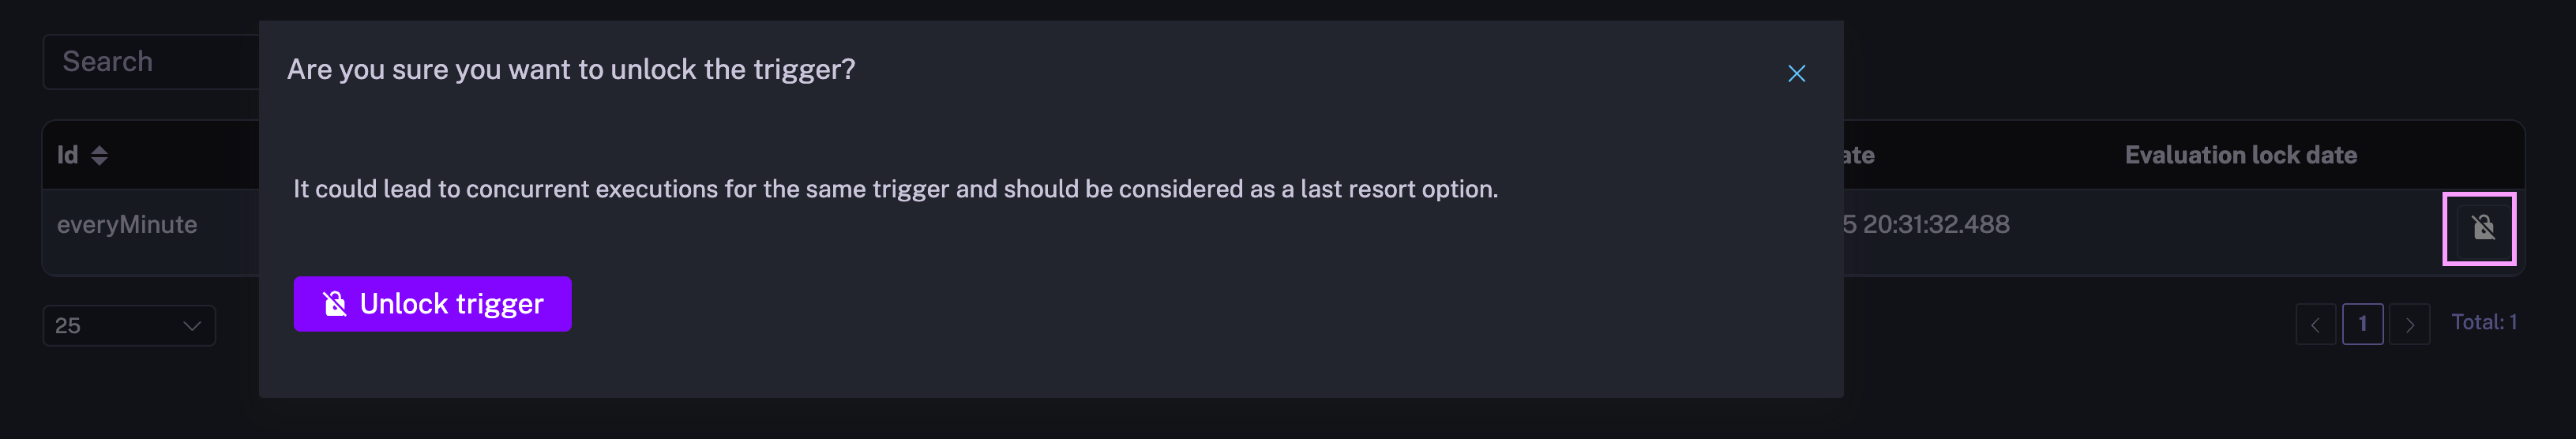
The triggers page gives an overview of all triggers, grouped by a namespace. You can see the last time a given trigger was modified and whether there are some executions currently in progress that have been executed as a result of that trigger. For instance, the image below shows that the trigger named everyMinute is currently locked due to an Execution in progress.
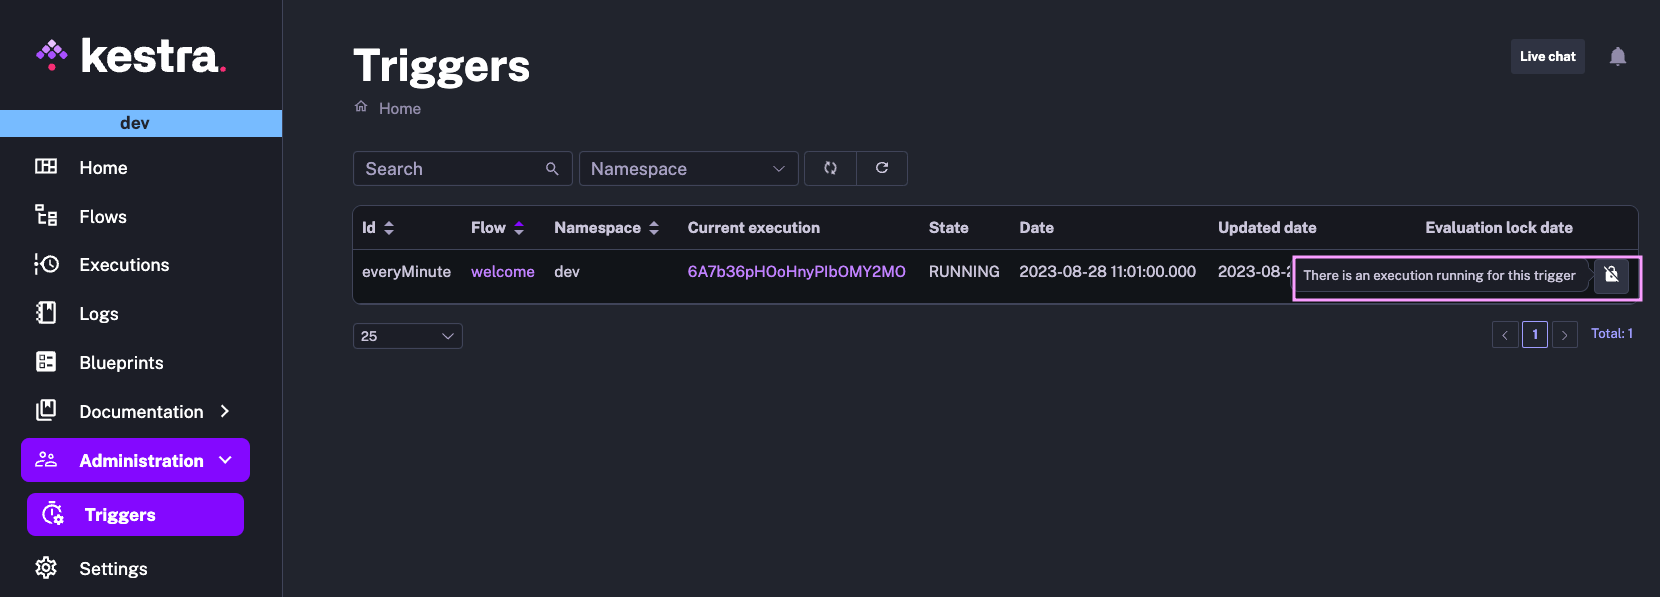
You can either troubleshoot why this execution is still in progress (e.g., a process stuck due to infrastructure issues) or manually unlock this trigger. Note that manually unlocking triggers may result in multiple concurrent (potentially duplicated) executions.
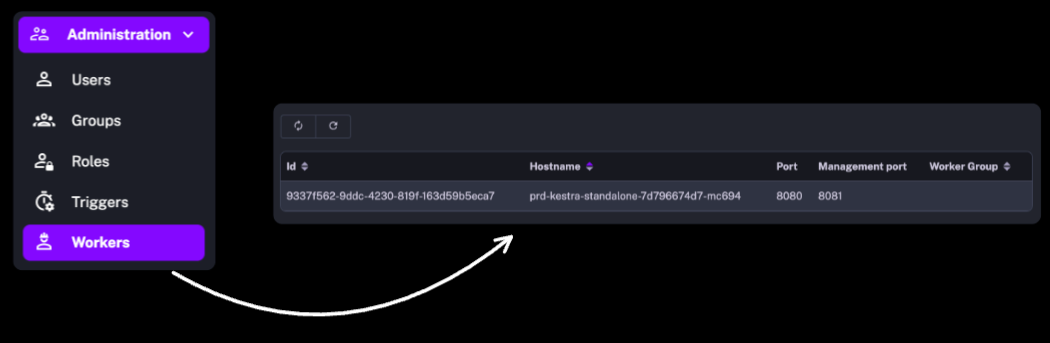
In the Enterprise Editon, the Administration section also includes user management (Users, Groups, Roles) as well as the recently introduced Workers to help you monitor the health of the remote infrastructure.
We’ve added several Command Line Interface tasks to help you automate any process or service API calls on AWS, Google Cloud and Microsoft Azure.
We’ve also introduced additional CLI tasks to the following existing plugins:
DbtCLI task to run any dbt commandSparkCLI task to submit custom jobs to a Spark cluster.Using the gcloud CLI task, you can automate virtually any action that you can perform on Google Cloud Platform. Below is an example from the blueprints catalog showing various ways of capturing relevant API responses from the CLI output.
id: gcloudCLInamespace: company.team
tasks:  - id: hello    type: io.kestra.plugin.gcp.cli.GCloudCLI    serviceAccount: "{{ secret('GCP_CREDS') }}"    projectId: yourProject    commands:      - gcloud storage ls # plain text e.g. gs://bucket/      - gcloud storage ls --json > {{outputDir}}/storage.json # output to file makes it available for further processing or download.      - gcloud storage ls --json | tr -d '\n ' | xargs -0 -I {} echo '::{"outputs":{"gcloud":{}}}::' # output to Kestra output variables allows passing those variables to downstream tasks
AWS CLI is useful for automating tasks on Amazon Web Services. With the AWS CLI task, you can trigger any API call interacting with your AWS resources as part of your end-to-end workflow. Below is a simple example from the blueprints catalog listing AWS ECS clusters from the AwsCLI task.
id: awsCLIlistECSclustersnamespace: company.team
tasks: - id: aws type: io.kestra.plugin.aws.cli.AwsCLI accessKeyId: "{{ secret('AWS_ACCESS_KEY_ID') }}" secretKeyId: "{{ secret('AWS_SECRET_ACCESS_KEY') }}" region: "us-east-1" commands: - aws ecs list-clusters --query 'clusterArns[*]' - aws ecs list-clusters > {{outputDir}}/output.jsonThis release also introduces the az CLI task to automate any Azure task from the Command Line, as shown in the following blueprints example.
id: azureCLInamespace: company.team
tasks: - id: listAzureRegions type: io.kestra.plugin.azure.cli.AzCLI tenant: "{{ secret('AZURE_TENANT_ID') }}" username: "{{ secret('AZURE_SERVICE_PRINCIPAL_CLIENT_ID') }}" password: "{{ secret('AZURE_SERVICE_PRINCIPAL_PASSWORD') }}" servicePrincipal: true commands: - az account list-locations --query "[].{Region:name}" -o tableYou can use the new Spark CLI to orchestrate Spark jobs. The blueprint shown below submits PySpark code from Git to a Spark cluster.
id: gitSparknamespace: company.team
tasks:- id: working_directory  type: io.kestra.core.tasks.flows.WorkingDirectory  tasks:    - id: git      type: io.kestra.plugin.git.Clone      url: https://github.com/kestra-io/scripts      branch: main
    - id: spark_job      type: io.kestra.plugin.spark.SparkCLI      commands:        - spark-submit --name Pi --master spark://localhost:7077 etl/spark_pi.py
Similarly to SparkCLI, the new DbtCLI task can be used to orchestrate any dbt command. Below is a Blueprint example running dbt deps and dbt build commands.
id: dbtGitDockerDuckDBnamespace: company.team
tasks:  - id: dbt    type: io.kestra.core.tasks.flows.WorkingDirectory    tasks:      - id: cloneRepository        type: io.kestra.plugin.git.Clone        url: https://github.com/kestra-io/dbt-demo        branch: main
- id: dbt-build type: io.kestra.plugin.dbt.cli.DbtCLI runner: DOCKER docker: image: ghcr.io/kestra-io/dbt-duckdb:latest profiles: | jaffle_shop: outputs: dev: type: duckdb path: ":memory:" extensions: - parquet fixed_retries: 1 threads: 16 timeout_seconds: 300 target: dev commands: - dbt deps - dbt buildThis release introduces new integrations to automate data lake processes including data ingestion and transformation.
Amazon Athena is a serverless query engine allowing to analyze data in Amazon S3 using standard SQL. You can now use the new AWS task to run any SQL query on Athena. For detailed integration examples, check our Apache Iceberg Crash Course for AWS users.
Databricks is a unified data analytics platform that provides a collaborative workspace for data scientists, engineers, and machine learning practitioners. The Databricks plugin allows managing Databricks jobs, clusters, files and queries as part of your end-to-end automated data pipelines in Kestra. Here are example use cases available in the blueprints catalog:
CreateJob APISubmitRun APIWe’ve added two new tasks to integrate Kestra with Vertex AI APIs using Google’s PaLM 2 Large Language Models.
To see both of these tasks in action, check the blog post by Loïc Mathieu.
Our community member, Antoine Balliet, contributed a Hightouch plugin that allows triggering Hightouch syncs as part of end-to-end processes. The task is fully declarative — add a Hightouch API token and a sync ID, and start syncing data from a data warehouse to your SaaS tools.
id: bigquery_to_gsheetsnamespace: company.teamtasks: - id: reverseETL type: io.kestra.plugin.hightouch.Sync token: "{{ secret('HIGHTOUCH_API_TOKEN') }}" syncId: 1716609We’ve extended the existing Singer plugin to support the following new taps:
The DuckDB plugin now supports MotherDuck. All DuckDB blueprints now also work with MotherDuck as long as you provide the MotherDuck service token and database name in your JDBC URL.
We recommend storing the MotherDuck service token as a Kestra Secret. Below is an example pointing the Query task to the MotherDuck database named my_db and referencing the token stored as MOTHERDUCK_TOKEN secret:
- id: query type: io.kestra.plugin.jdbc.duckdb.Query sql: | SELECT * FROM read_csv_auto('your_file.csv') WHERE price * quantity != total; store: true url: "jdbc:duckdb:md:my_db?motherduck_token={{ secret('MOTHERDUCK_TOKEN') }}"You can read more about various use cases for using MotherDuck with Kestra in our guest blog post on the MotherDuck blog Beyond storing data: how to use DuckDB, MotherDuck and Kestra for ETL.
So far, Kestra has supported custom scripts written in Python, R, Node.js, Shell and Powershell. With this release, we’ve also added support for Julia.
We’ve also improved the documentation for new script plugins.
There is a new plugin allowing you to send notifications using Telegram.
Below is a simple example:
id: telegramnamespace: company.teamtasks: - id: telegram_notification type: io.kestra.plugin.telegram.TelegramSend channel: "@general" token: "{{ secret('TELEGRAM_BOT_TOKEN') }}" payload: "Hello from Kestra!"Templates are now marked as deprecated. Please use subflows instead. The migration documentation explains why templates are being phased out and how to transition from templates to subflows.
If you are using templates and you are not ready to migrate to subflows yet, add the following Kestra configuration option to still be able to use them:
kestra: templates: enabled: trueBefore Kestra 0.10.0, script tasks were offered exclusively by the core plugin (the one which is always included in any Kestra distribution). In 0.10.0, we introduced new script tasks maintained using dedicated script plugins which offer script tasks for Python, R, Node.js, Shell and Powershell (and now, also Julia). Since then, the old core scripting tasks have been deprecated and moved out of the core plugin.
If you use one of these core script tasks e.g. io.kestra.core.tasks.scripts.python, you should migrate to the new script task that runs by default in a Docker container and is more feature-rich. Using the same Python task as an example, you should now use the io.kestra.plugin.scripts.python.Script task instead.
Our *-full Docker images include both the new and the deprecated core script tasks. If you’re not using our *-full Docker images in which plugins are preinstalled, make sure to install the new script plugins as the deprecated tasks are now packaged alongside the new script plugins.
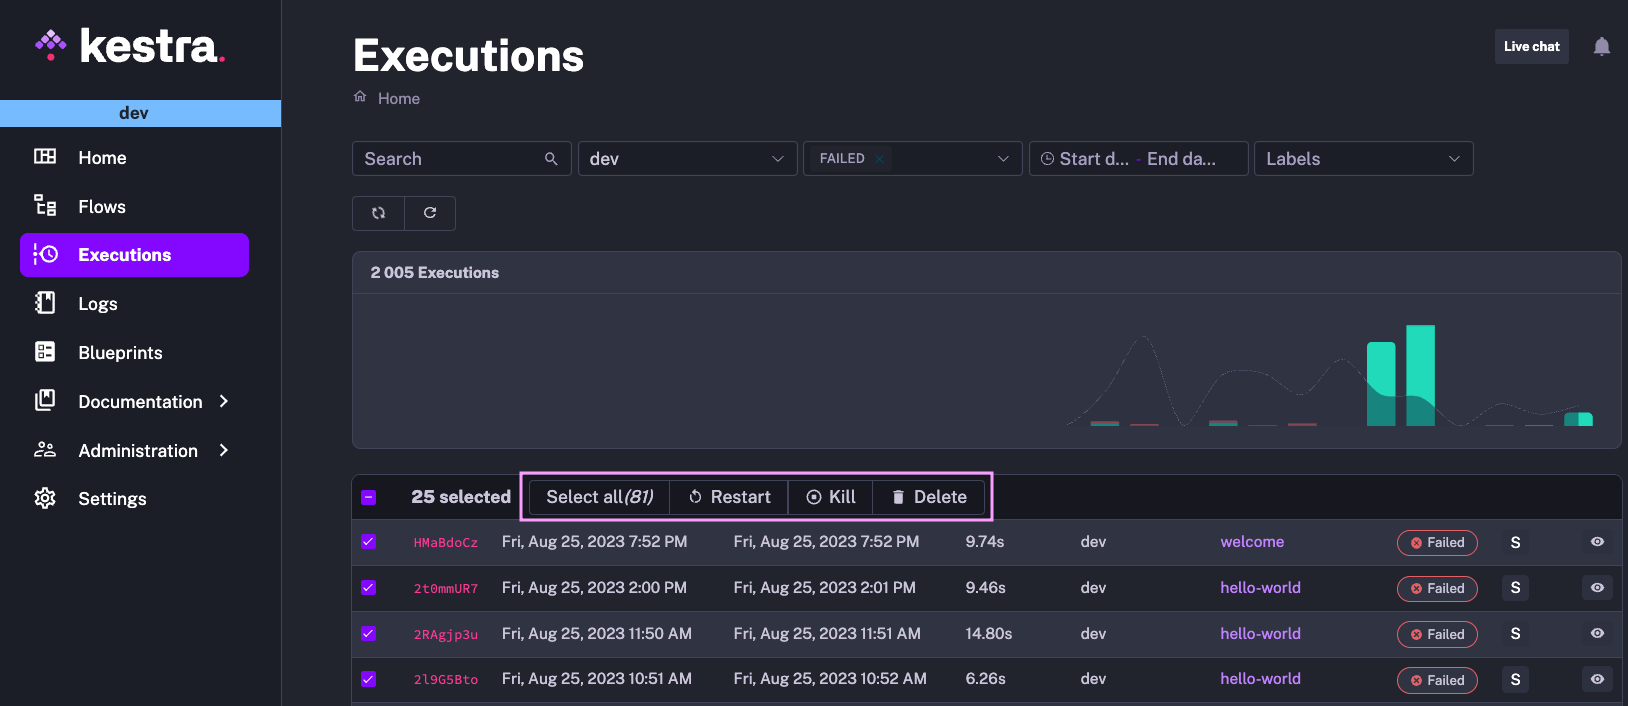
Several tables in Kestra allow you to perform bulk operations, such as exporting, (re)enabling, disabling, or deleting multiple flows at once, as well as deleting, killing, or restarting multiple executions. The results in the table are paged. Sometimes you would need to scroll down to the very bottom to select all elements. We’ve relocated that configuration to the top of the table to make bulk actions more accessible.
In the example below, you can select all elements in just one click and easily perform any bulk operation.
We have further improved performance across multiple areas, including:
kestra sys reindex --type flow.The documentation enhancements include, among others:
This post covered new features and enhancements added in Kestra 0.11.0. Which of them are your favorites? What should we add next? Your input and feedback is always appreciated.
If you have any questions, reach out via Kestra Community Slack or open a GitHub issue.
If you like the project, give us a GitHub star and join the open-source community.

Stay up to date with the latest features and changes to Kestra