Authors
Loïc Mathieu
Lead Developer
Loïc Mathieu
Lead Developer
Observability is essential when running workflows in production. You need to know what happened, when, and why — especially when things go wrong.
OpenTelemetry has become the standard for collecting and analyzing telemetry data in distributed systems. It provides a common format for traces, metrics, and logs, making it easier to connect systems and monitor their behavior.
Kestra supports OpenTelemetry out of the box. You can export traces for every execution, task run, and API call, giving you full visibility into what your flows are doing.
In this post, we’ll focus on tracing — how to enable it, how it works in Kestra, and how to use tools like Jaeger to analyze flow executions. If you’re looking for metrics or logs, check out OpenTelemetry guide.
you’ll need:
OpenTelemetry traces capture each step of an execution as spans. In Kestra, this gives you detailed visibility into flow behavior, task execution, and performance.
First, we need to enable OpenTelemetry traces and configure an exporter. We will use Jaeger as an OpenTelemetry collector. Jaeger is an open-source, distributed tracing platform and an essential tool for monitoring distributed workflows.
Configuring OpenTelemetry is done in three steps: enable globally, configure OTLP exporter, and enable for Kestra flows:
# 1. Enable OpenTelemetry traces globallymicronaut:  otel:    enabled: false
# 2. Configure an OTLP exporter to export on localhost to the gRPC port of Jaegerotel:  traces:    exporter: otlp  exporter:    otlp:      endpoint: http://localhost:4317 # Jaeger OTLP/gRPC is on port 4317
# 3. Enable OpenTelemetry traces in Kestra flowskestra:  traces:    root: DEFAULT
You can enable OpenTelemetry traces without enabling it inside Kestra flows, in this case you will only have traces accessible through the Kestra API and not inside the context of your flow executions. This provides flexibility in monitoring strategies as needed.
You can launch Jaeger with the following Docker compose snippet:
services: jaeger-all-in-one: image: jaegertracing/all-in-one:latest ports: - "16686:16686" # Jaeger UI - "14268:14268" # Receive legacy OpenTracing traces, optional - "4317:4317" # OTLP gRPC receiver - "4318:4318" # OTLP HTTP receiver - "14250:14250" # Receive from external otel-collector, optional environment: - COLLECTOR_OTLP_ENABLED=trueIf you don’t see any traces in the Jaeger UI, make sure:
4317 by default)Let’s first test with an Hello World flow:
id: hello-worldnamespace: company.team
tasks:  - id: hello    type: io.kestra.plugin.core.log.Log    message: Hello World! 🚀
After launching a flow execution, go to the Jaeger UI (http://localhost:16686/), select Kestra as a service, and hit Find Traces.
You will see traces for every API call, providing a detailed view of execution flows and interactions within the system.
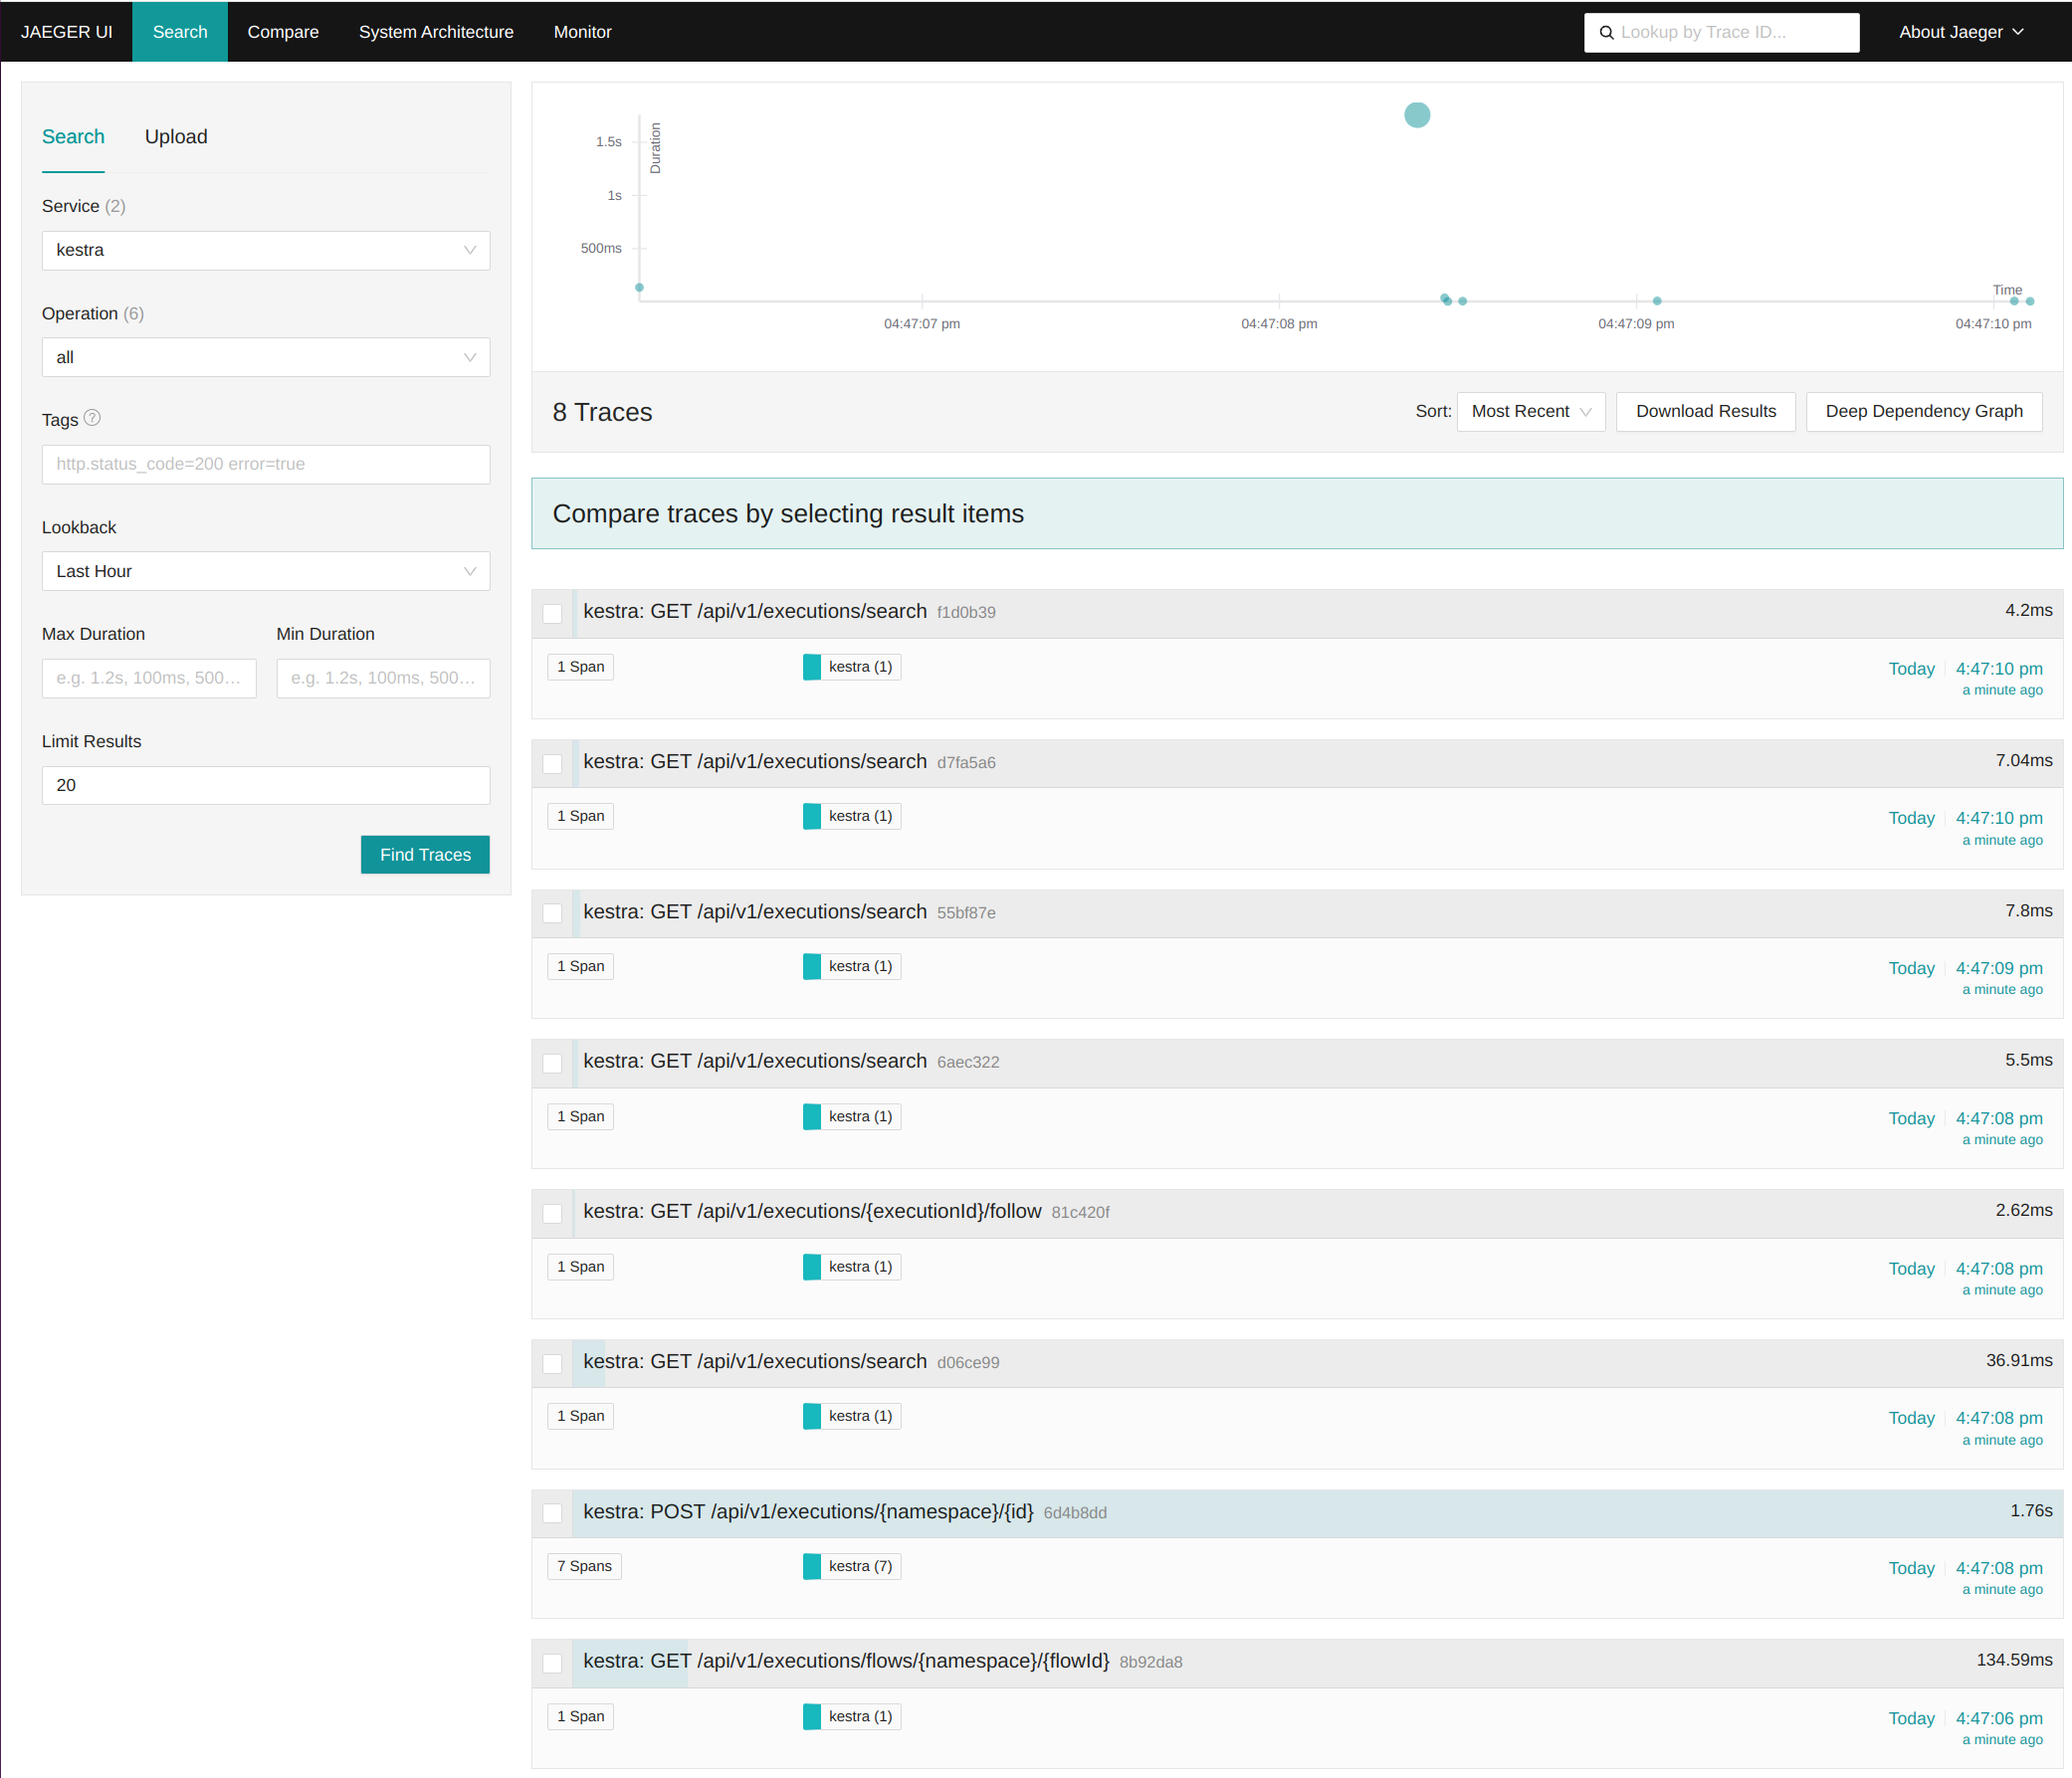
Most interesting is the trace that starts an execution. Its name is POST /api/v1/executions/{namespace}/{id} and you can see it has 7 spans. Click on it to view span details, including execution order and timing.
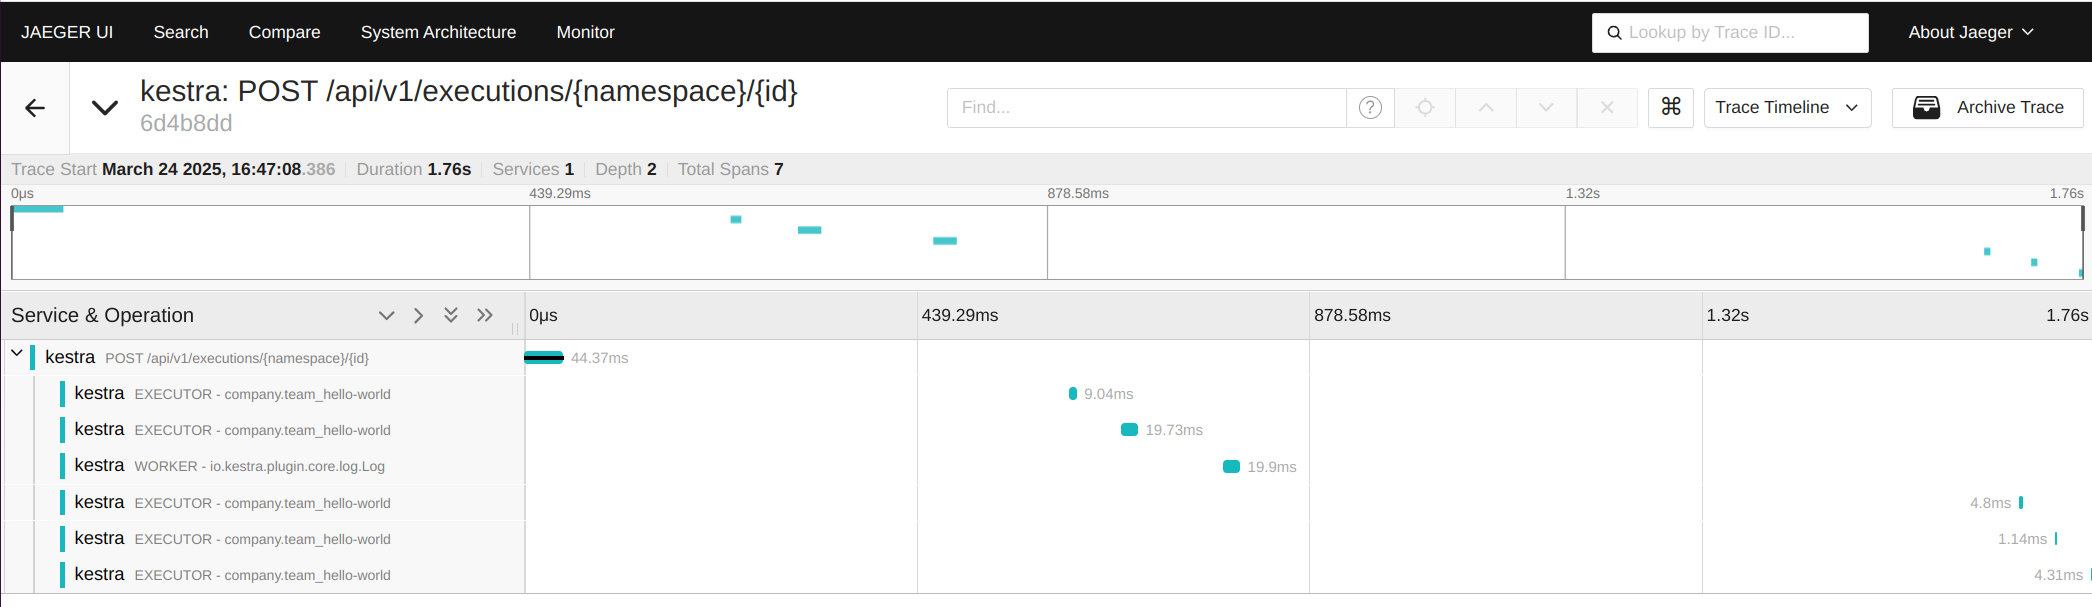
The trace starts inside the API, then you can see 6 spans inside Kestra itself. Those spans are children of the API span, and each span has a duration that is displayed in a timeline, making it easy to analyze performance bottlenecks.
Inside Kestra, there a multiple kinds of spans, but two are particularly relevant:
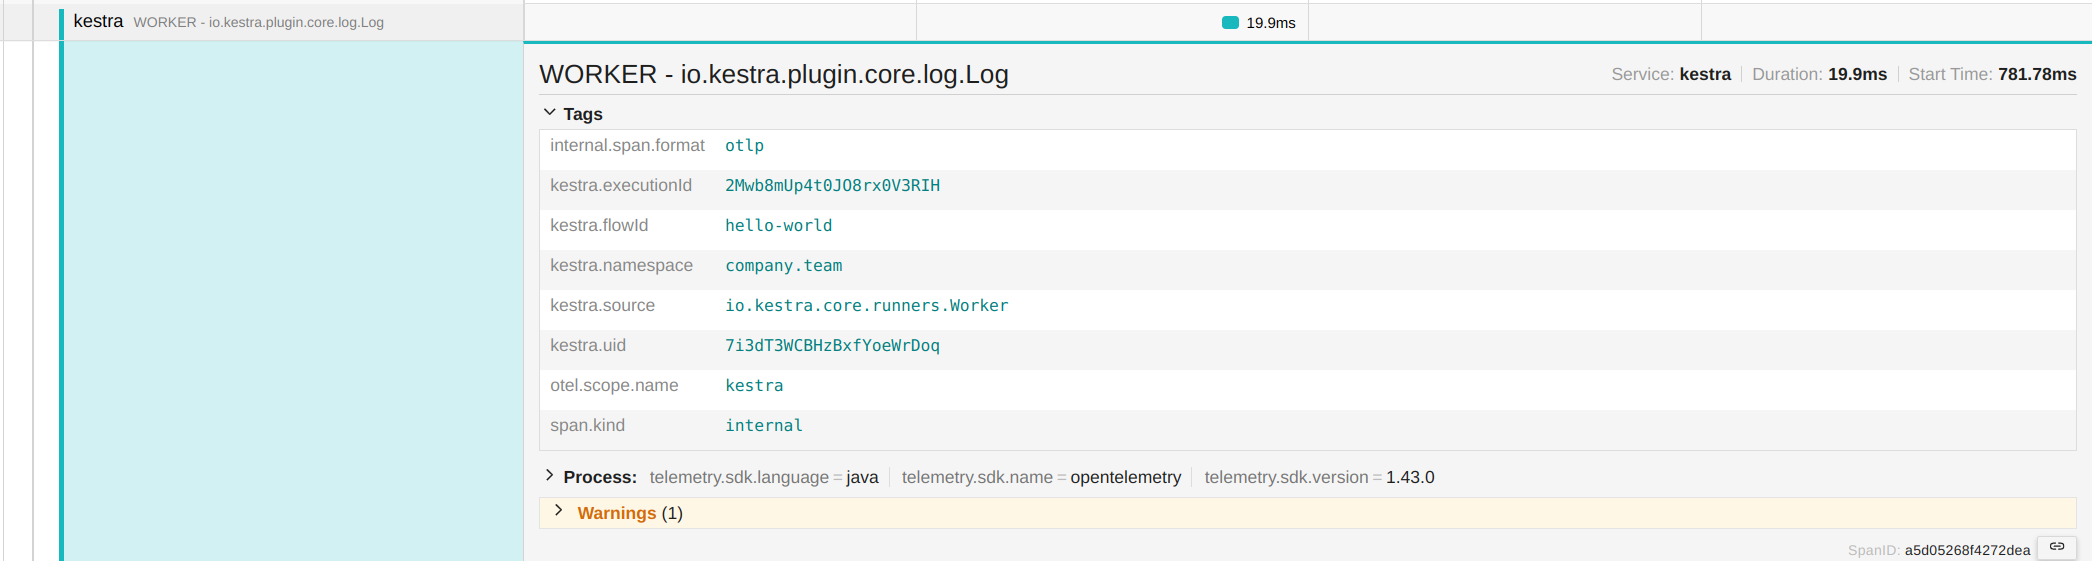
If you click on a span, you will see additional information stored inside the span. Here, clicking on Tags reveals execution details such as namespace, flow ID, execution ID, and task run ID. This metadata helps track executions and correlate logs with traces.
Kestra supports correlation between parent and child flow executions. With OpenTelemetry, you can visualize how subflows are triggered and how they relate to their parent executions.
A key aspect of workflow orchestration is monitoring relationships between flows. OpenTelemetry traces help visualize execution dependencies between a parent flow and its subflows.
To demonstrate, let’s define a parent flow that triggers the hello-world flow as a subflow on each execution:
id: parentnamespace: company.team
tasks:  - id: hello    type: io.kestra.plugin.core.log.Log    message: I'm your father  - id: subflow    type: io.kestra.plugin.core.flow.Subflow    namespace: company.team    flowId: hello-world
If you start an execution and inspect its trace, you will see 19 spans and a correlated sub-trace for the subflow execution.
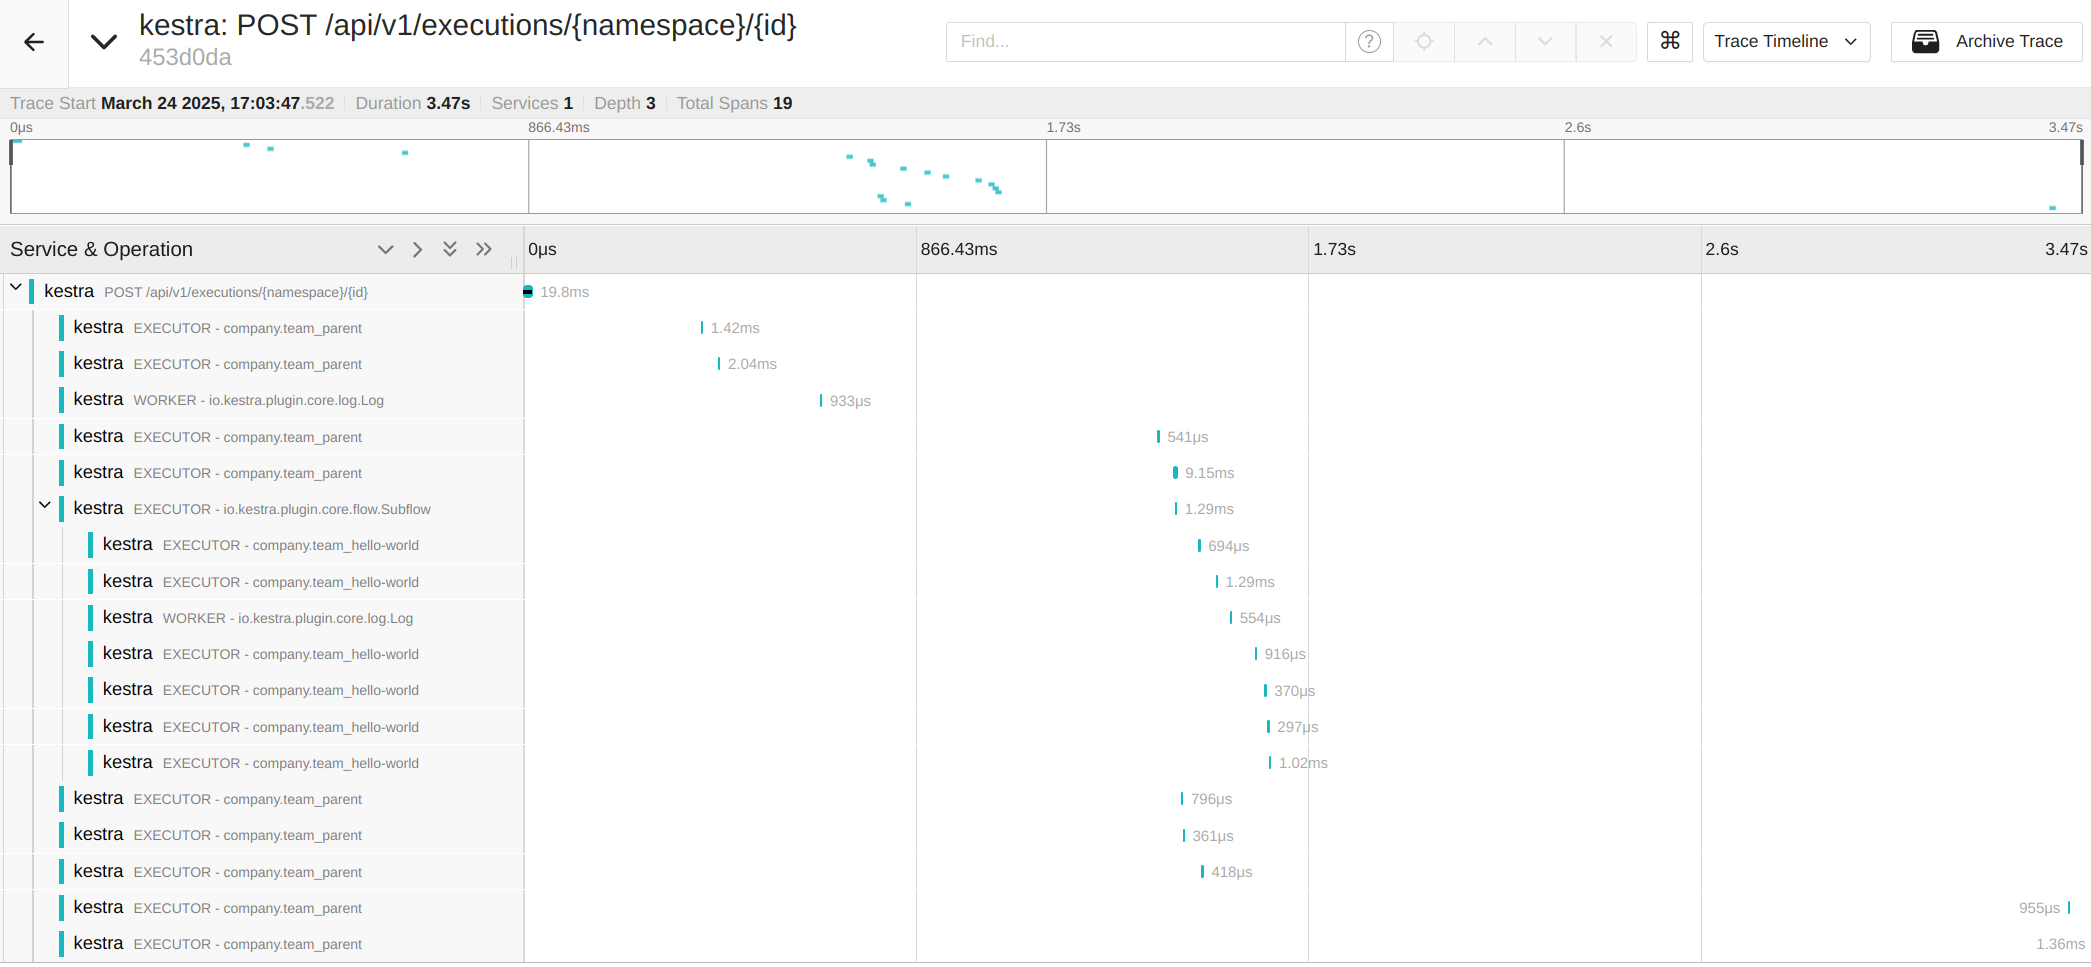
The parent execution includes a span named EXECUTOR - io.kestra.plugin.core.flow.Subflow; this is the Subflow task that creates it. Following this span, you will see a correlated trace containing the 7 spans from the subflow execution. This structure helps track workflow dependencies across multiple flow executions.
Kestra can link traces across systems using OpenTelemetry context propagation. When another system calls Kestra, or Kestra calls an external HTTP endpoint, the trace context is passed along — giving you a unified view across services.
As we already saw, all API calls generate traces, but OpenTelemetry provides additional benefits when correlated across services. If an external system that supports OpenTelemetry makes an API call to Kestra, the trace will be linked to that external system’s trace, offering end-to-end visibility.
In the same manner, any HTTP calls made by a Kestra task automatically include OpenTelemetry trace headers. If the receiving service is instrumented with OpenTelemetry, these traces are linked, enabling seamless observability across services.
By leveraging OpenTelemetry traces, you gain a unified, end-to-end view of your entire system, making it easier than ever to track executions, diagnose issues, and optimize performance across distributed workflows.
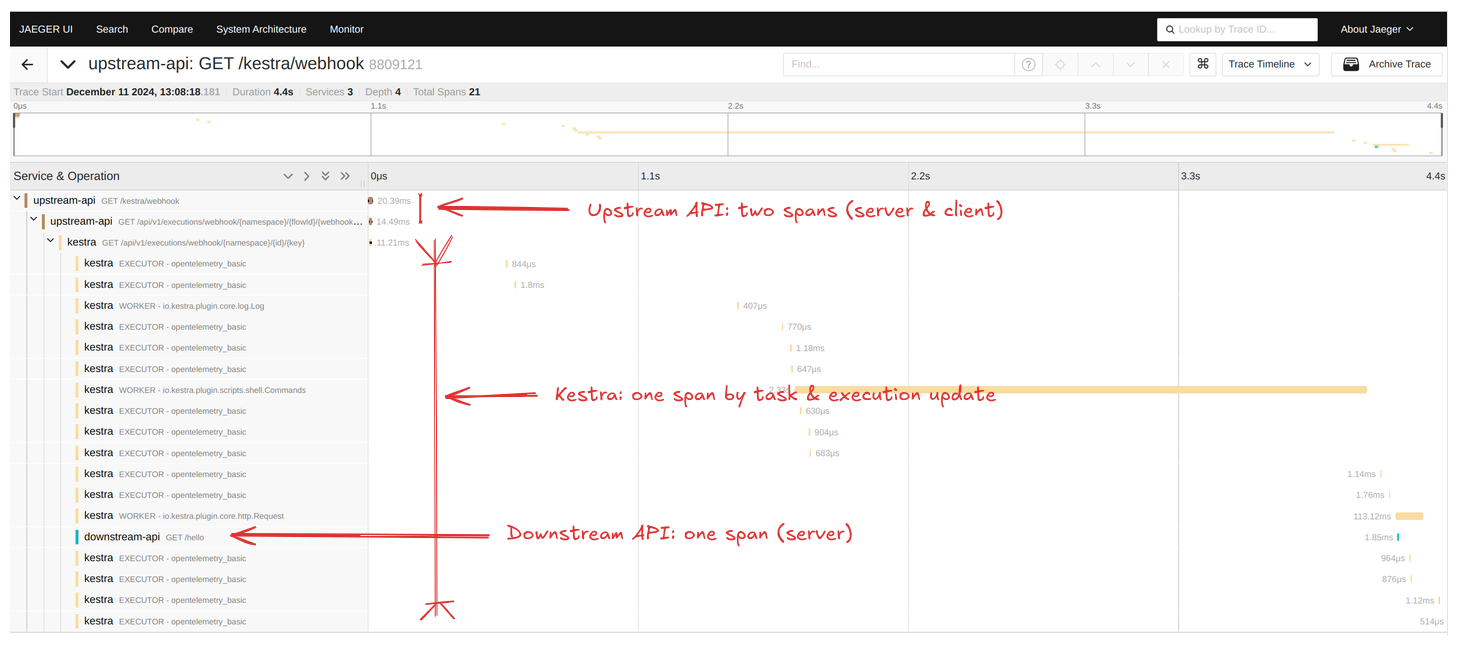
In the following screenshot, you can see a trace starting in an external service called upstream.
This service triggers a new flow execution via a webhook. The flow then makes an HTTP request using the io.kestra.plugin.core.http.Request, calling the downstream external service.
Finally, you can see a trace inside the downstream external service for the /hello HTTP endpoint, linking all interactions together.
With OpenTelemetry traces, Kestra provides a powerful way to monitor, debug, and optimize flow executions. Traces help visualize execution timelines, correlate parent-child workflows, and track external interactions. By integrating OpenTelemetry into Kestra, teams gain deep insights into execution patterns, allowing them to improve performance, troubleshoot issues efficiently, and ensure reliable data processing workflows.
If you have any questions, reach out via Slack or open a GitHub issue.
If you like the project, give us a GitHub star and join the community.

Stay up to date with the latest features and changes to Kestra