Collect traces, metrics, and logs with OpenTelemetry
For the complete documentation index, see llms.txt. For a full content snapshot, see llms-full.txt. Append.mdto anykestra.io/docs/*URL for plain Markdown.
Observability refers to understanding a system’s internal state by analyzing its outputs. In software, this means examining telemetry data — such as traces, metrics, and logs — to gain insights into system behavior.
OpenTelemetry is a vendor-neutral, tool-agnostic framework and toolkit for creating and managing telemetry data. It helps implement observability in software applications.
OpenTelemetry defines three different kinds of telemetry data:
- Traces provide a high-level view of what happens when a request is made to an application. A trace can contain multiple spans.
- Metrics are measurements of a service captured at runtime.
- Logs are timestamped text records, either structured (recommended) or unstructured, with optional metadata.
Kestra supports all three kinds of telemetry data via OpenTelemetry-compatible exporters. For more details, see the OpenTelemetry official documentation.
Traces
Exporting trace data in Kestra is currently a Beta feature.
The first step is to enable distributed traces inside the Observability and Networking configuration file:
micronaut: otel: enabled: truekestra: traces: root: DEFAULT # Enable traces inside Kestra flow executionsotel: traces: exporter: otlp # Only otlp is supported for now exporter: otlp: endpoint: http://localhost:4317 # Replace with the address of your own collectorWhen enabled, Kestra instruments:
- All calls to its API
- All flow executions (one span per task execution, plus one span for each execution message processed by the Executor)
- External HTTP calls made by the HTTP tasks (including tasks that use the Kestra HTTP client)
Trace correlation
Kestra propagates the trace context so that traces are correlated:
- The API call trace correlates with the execution it creates.
- Flow execution traces correlate with parent flows when the
SubfloworForEachItemtask is used. - External HTTP calls include the standard propagation header for downstream correlation.
Example: Jaeger with Docker Compose
Enable Jaeger, an OpenTelemetry-compatible tracing platform, with Kestra in a Docker Compose configuration file:
services: # Postgres is included here as a dependency for Kestra during local testing postgres: image: postgres:14.13 environment: POSTGRES_DB: kestra_unit POSTGRES_USER: kestra POSTGRES_PASSWORD: k3str4 ports: - 5432:5432 restart: on-failure
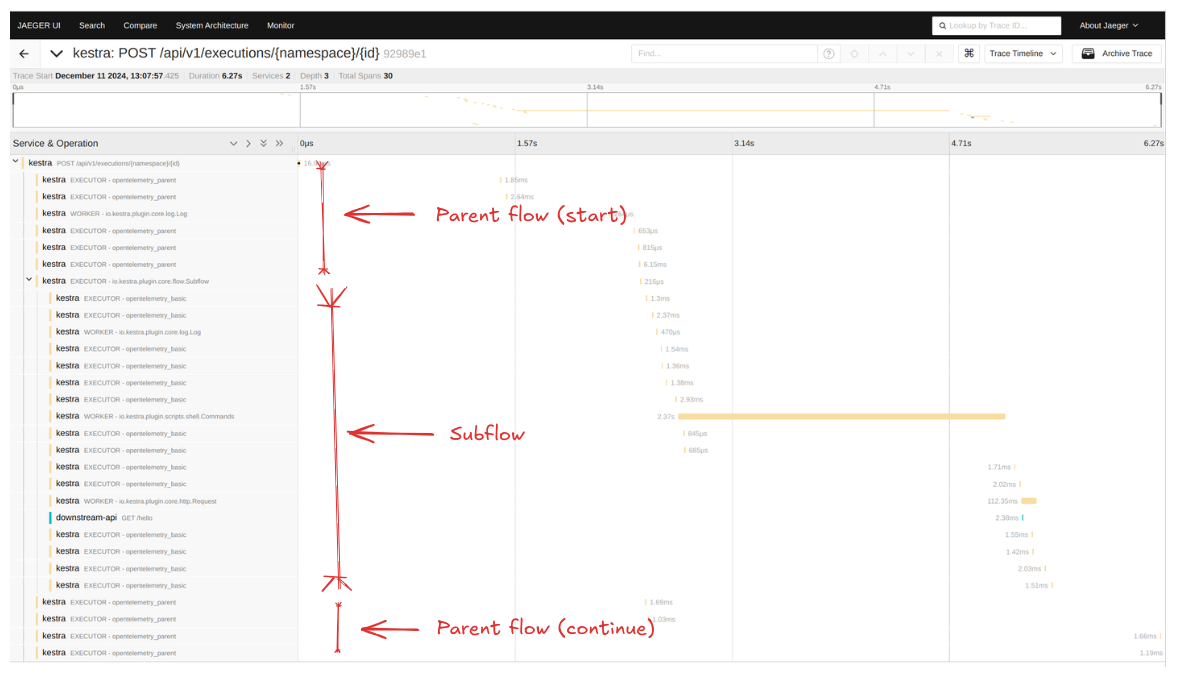
jaeger-all-in-one: image: jaegertracing/all-in-one:latest ports: - "16686:16686" # Jaeger UI - "14268:14268" # OpenTracing (optional) - "4317:4317" # OTLP gRPC receiver - "4318:4318" # OTLP HTTP receiver - "14250:14250" # External otel-collector (optional) environment: - COLLECTOR_OTLP_ENABLED=true restart: on-failureThe following screenshot shows three correlated traces:
- One created from the API call that creates the execution
- One created from an execution of a flow named
opentelemetry_parentwhich has spans for tasks including aSubflow - One created from the
opentelemetry_basicflow execution
Disabling traces
You can disable traces for flows while keeping API traces:
kestra: traces: root: DISABLEDYou can also disable traces per component (experimental). For example, disabling only Executor spans:
kestra: traces: root: DEFAULT categories: io.kestra.core.runners.Executor: DISABLEDSupported categories
| Category | Description |
|---|---|
io.kestra.core.runners.Executor | Spans for each message in the execution queue |
io.kestra.core.runners.Worker | Spans for each runnable task execution |
io.kestra.plugin.core.flow.Subflow | Spans for each Subflow task execution |
io.kestra.plugin.core.flow.ForEachItem | Spans for each ForEachItem task execution |
Metrics
To send metrics to an OpenTelemetry-compatible collector, add the following parameters to your Observability and Networking configuration file:
micronaut: metrics: export: otlp: enabled: true url: http://localhost:4318/v1/metrics # Replace with your collector URLFor example, you can configure an OpenTelemetry Collector to forward metrics to Prometheus:
receivers:  otlp:    protocols:      http:        endpoint: 0.0.0.0:4318
exporters:  prometheus:    endpoint: "0.0.0.0:9464"
Logs
To send logs to an OpenTelemetry-compatible collector, use the LogShipper with the built-in OpenTelemetry log exporter.
LogShipper is only available in the Kestra Enterprise Edition.
The following flow sends logs from all flows to a collector daily:
id: log_shippernamespace: company.team
triggers:  - id: daily    type: io.kestra.plugin.core.trigger.Schedule    cron: "@daily"
tasks: - id: log_export type: io.kestra.plugin.ee.core.log.LogShipper logExporters: - id: OTLPLogExporter type: io.kestra.plugin.ee.opentelemetry.LogExporter otlpEndpoint: http://localhost:4318/v1/logs # Replace with your collector URLWas this page helpful?