Track User Activity and Flow Executions with Audit Logs
For the complete documentation index, see llms.txt. For a full content snapshot, see llms-full.txt. Append.mdto anykestra.io/docs/*URL for plain Markdown.
Available on:Enterprise EditionCloud
Audit Logs record every action taken in your Kestra instance by users and service accounts.
Audit logs
By reviewing Audit Logs, system administrators can track user activity, and security teams can investigate incidents and ensure compliance with regulatory requirements.
Why audit logs matter
Audit logs are a historical record that developers and system administrators can use to track changes, monitor system usage, and verify system activity. They track the sequence of activities, ensuring accountability and providing data for troubleshooting and analysis. Because audit logs are immutable, they can also be used to detect and investigate security incidents. If you use the Elasticsearch backend, you can use Kibana to search and visualize your logs.
Accessing audit logs
Audit logs are available under the Tenant section in the UI. The page provides a detailed table of recorded events:
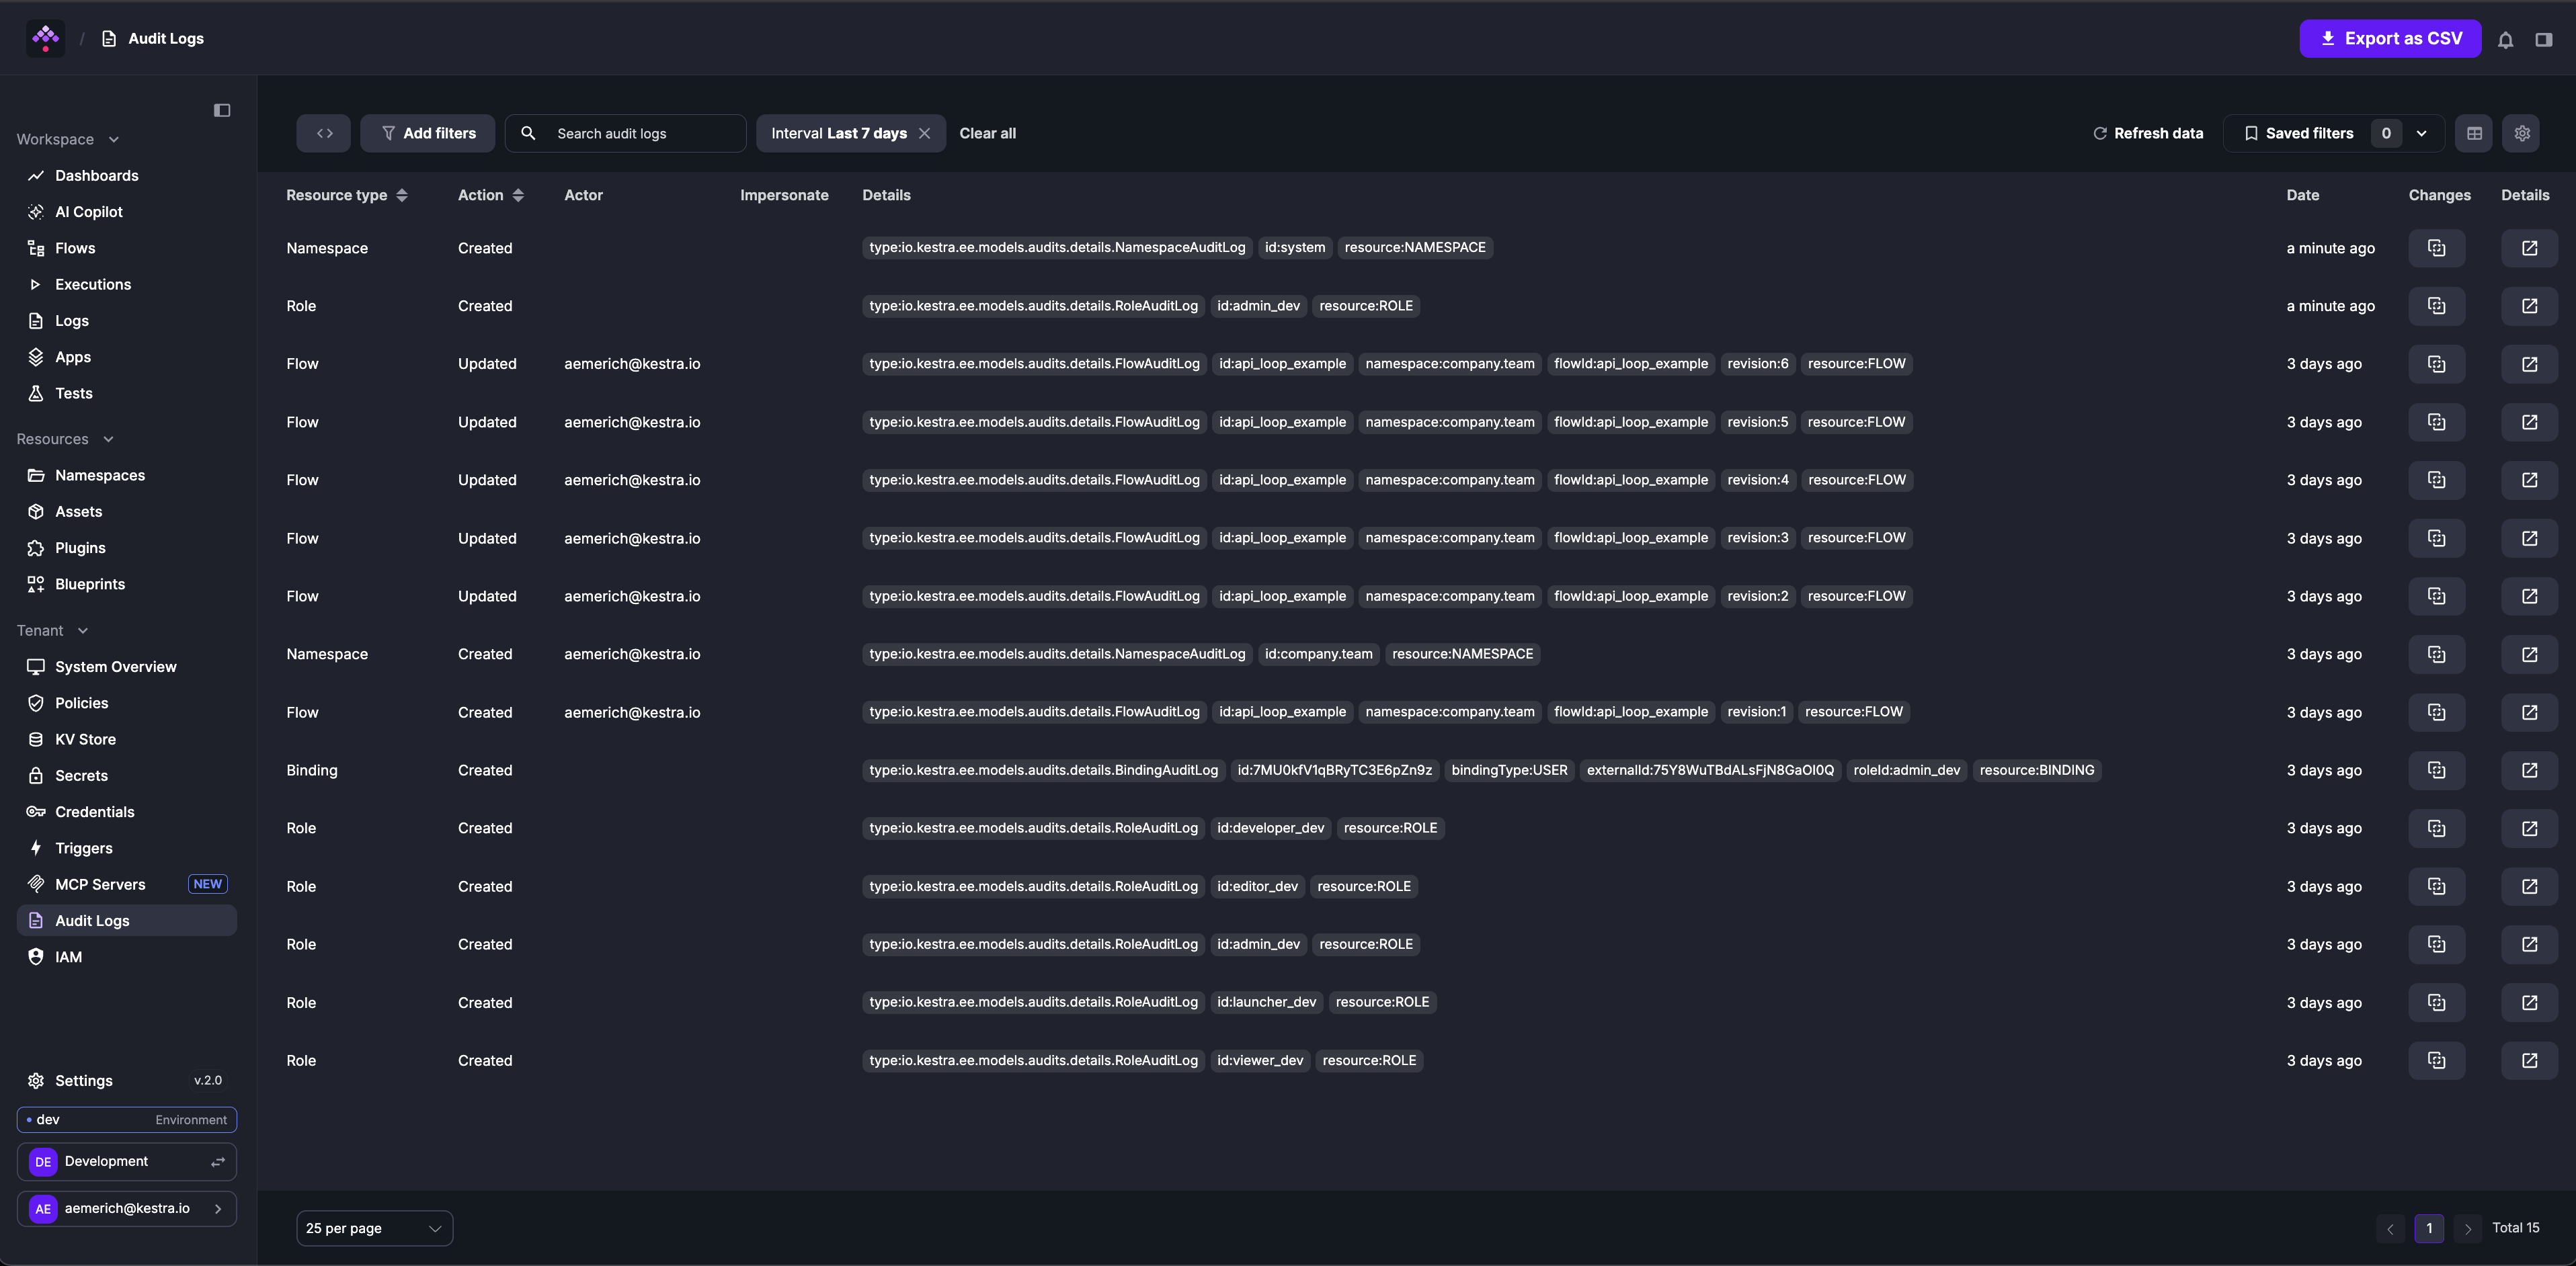
Each row in the table represents a distinct event with several columns providing specific details:
- Resource Type column categorizes the resource that the event is associated with, such as editing a flow (FLOW) or executing it (EXECUTION).
- Action indicates whether a given resource has been created, updated, or deleted.
- Actor identifies who performed the action. The user can be a human, a system, or a service account.
- Details section offers an in-depth description of the event, including identifiers such as the
id,namespace,flowId,executionId, revision, etc. — those fields depend on the type of resource the event is associated with. - Date represents the timestamp of when the event occurred.
- Changes shows two buttons: one to view the revision and a second to link you directly to the resource that created the log.
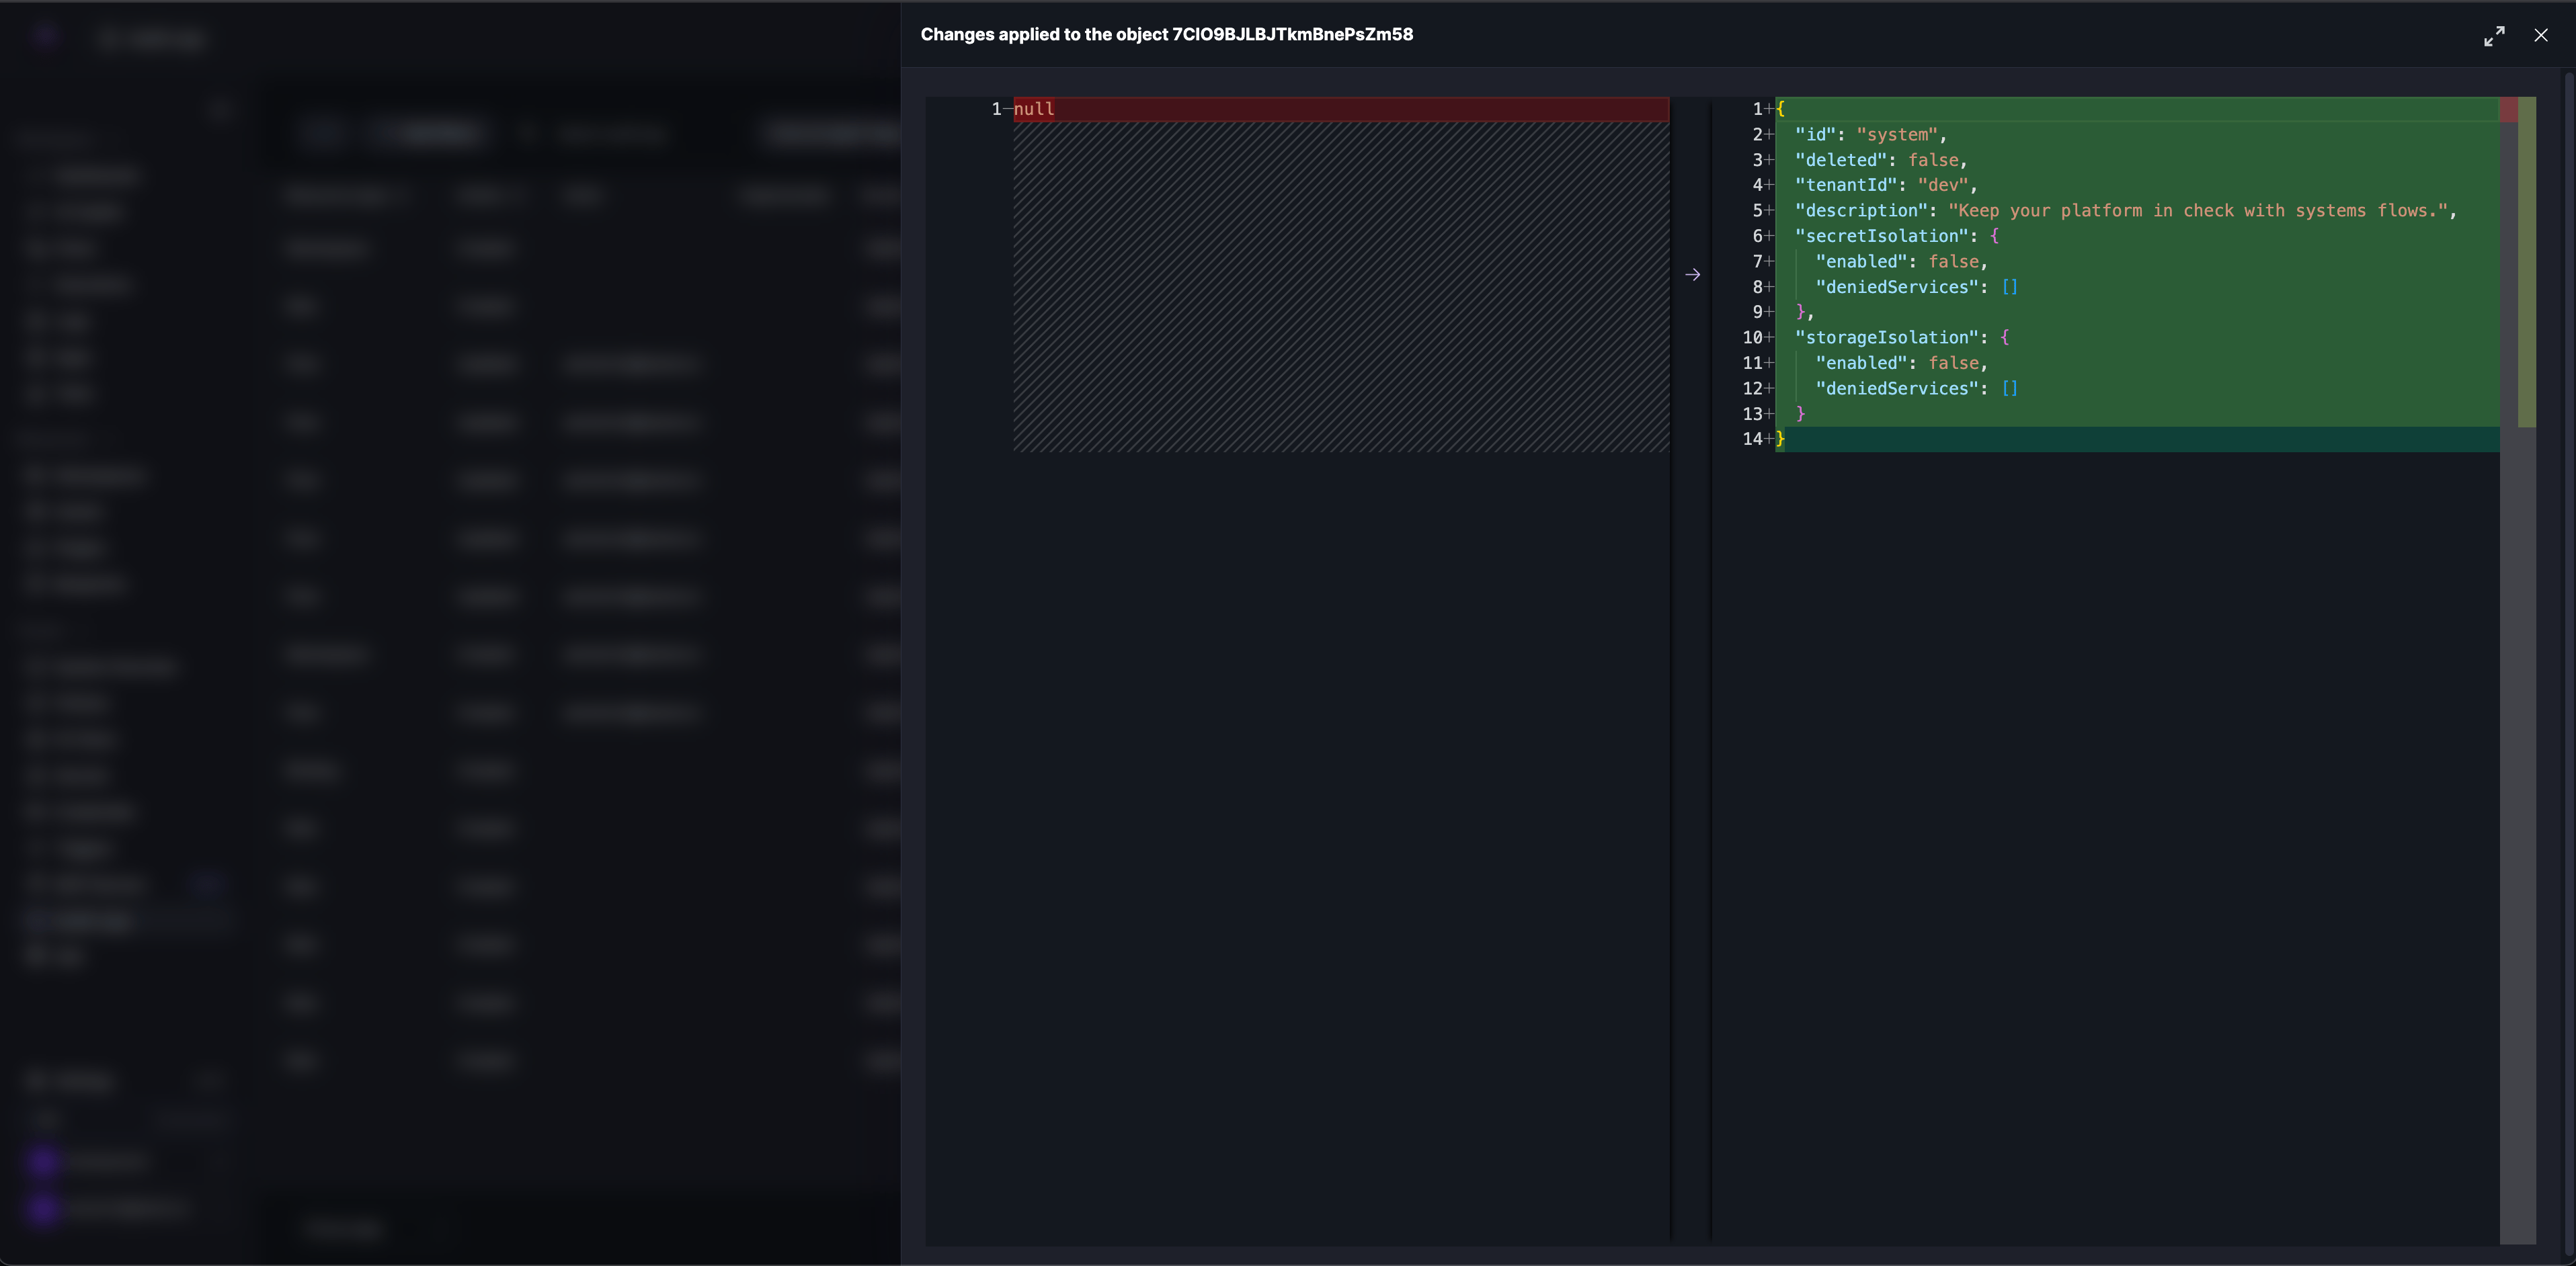
Full diff view
The icon in the Changes column opens the full diff for that event, showing the before and after states side-by-side:
Filtering audit logs
The Add filters button opens the Advanced filter dialog. Multiple conditions can be combined; for example, Interval (Last 7 days) and Resource type (NAMESPACE):
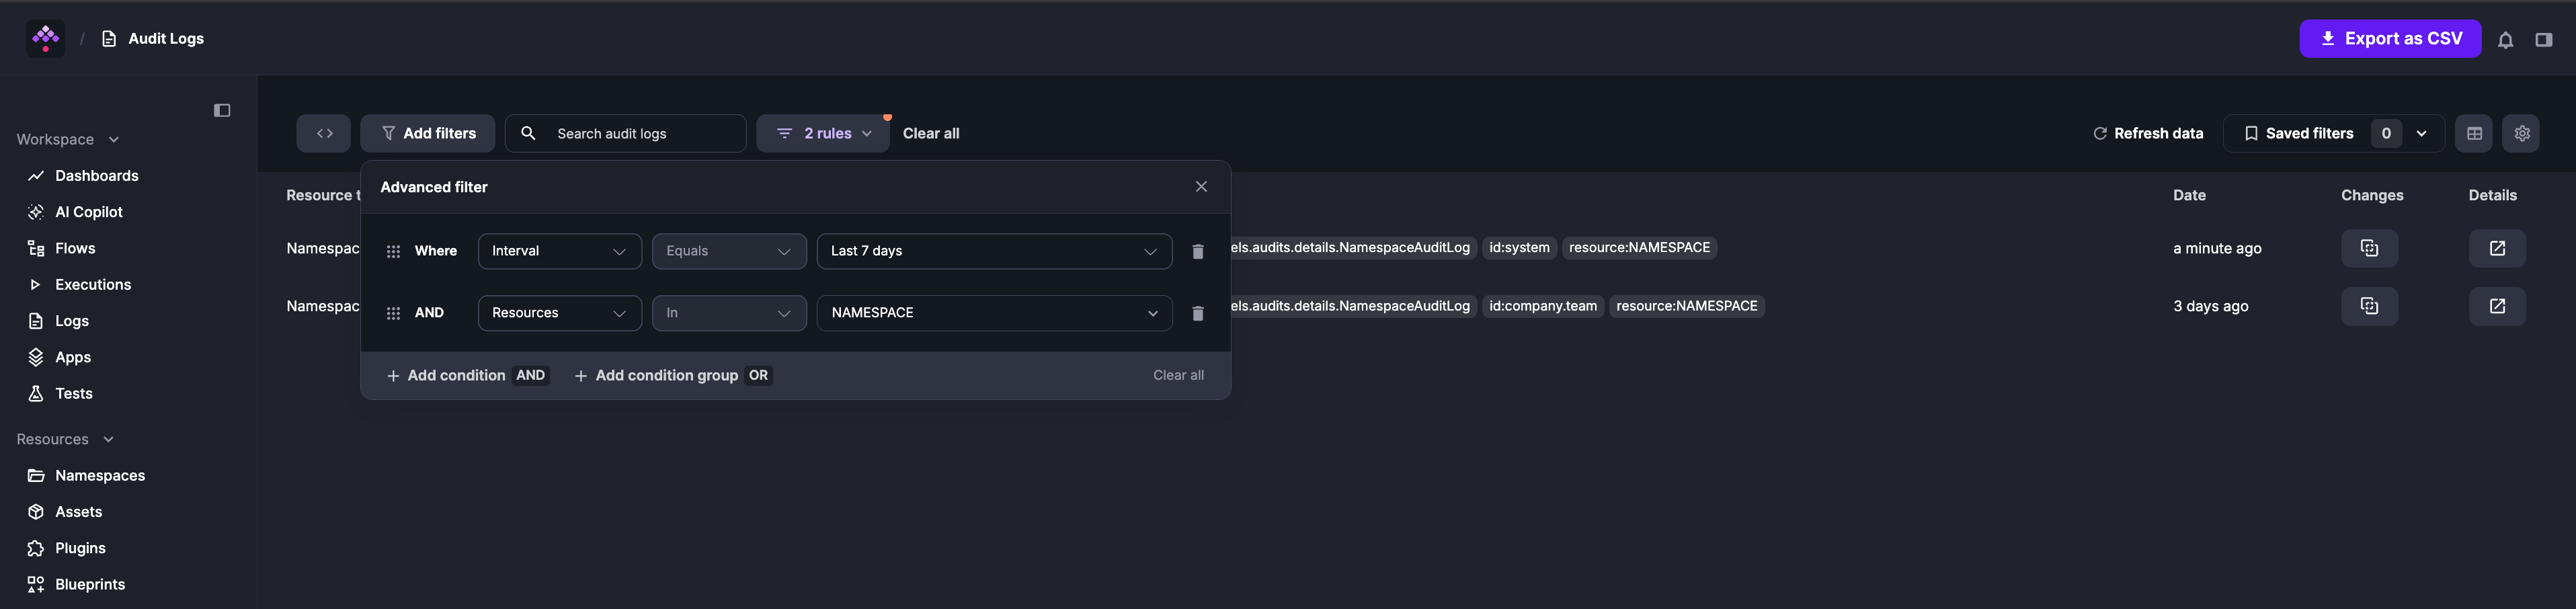
To filter for a specific event, click any tag in the Details column to add it as a filter condition.
Purging audit logs
Audit logs accumulate over time. The PurgeAuditLogs task removes old records, with filters for date range, namespace, resources, and actions (CREATE, READ, UPDATE, DELETE).
Additional Purge tasks are described in the dedicated section.
Example retention policy that purges audit logs older than one month:
id: audit_log_cleanupnamespace: systemtasks: - id: purge_audit_logs type: io.kestra.plugin.ee.core.log.PurgeAuditLogs description: Purge audit logs older than 1 month endDate: "{{ now() | dateAdd(-1, 'MONTHS') }}"Note how the above flow is added to the system namespace, which is the default namespace for System Flows. This ensures that this maintenance flow and its executions are hidden from the main UI, making them only visible within the system namespace that can be managed by platform administrators.
Combining the System Flows functionality with the PurgeAuditLogs task provides a simple way to manage your audit logs as code and from the UI, ensuring you keep them as long as you need to stay compliant while keeping your database clean and performant.
Export audit logs
Audit logs can be forwarded to an external monitoring system such as Datadog, AWS CloudWatch, Google Operational Suite, and more with the Audit Log Shipper task.
Was this page helpful?