Set up alerts and monitor your Kestra instance in production
For the complete documentation index, see llms.txt. For a full content snapshot, see llms-full.txt. Append.mdto anykestra.io/docs/*URL for plain Markdown.
This page provides best practices for setting up alerting and monitoring in your Kestra instance.
Failure alerts are essential. When a production workflow fails, you should be notified immediately. To implement failure alerting, you can use Kestra’s built-in notification tasks, such as:
Technically, you can add custom failure alerts to each flow separately using the errors tasks:
id: onFailureAlertnamespace: company.team
tasks:  - id: fail    type: io.kestra.plugin.core.execution.Fail
errors:  - id: slack    type: io.kestra.plugin.slack.notifications.SlackIncomingWebhook    url: "{{ secret('SLACK_WEBHOOK') }}"    messageText: "Failure alert for flow `{{ flow.namespace }}.{{ flow.id }}` with ID `{{ execution.id }}`. Here is a bit more context about why the execution failed: `{{ errorLogs() }}`"
However, this can lead to boilerplate code when this errors configuration is duplicated across multiple flows.
For centralized namespace-level alerting, create a dedicated monitoring workflow with a notification task and a Flow trigger. Below is an example workflow that automatically sends a Slack alert as soon as any flow in a namespace company.analytics fails or finishes with warnings.
id: failureAlertToSlacknamespace: company.monitoring
tasks:  - id: send    type: io.kestra.plugin.slack.notifications.SlackExecution    url: "{{ secret('SLACK_WEBHOOK') }}"    channel: "#general"    executionId: "{{trigger.executionId}}"
triggers:  - id: listen    type: io.kestra.plugin.core.trigger.Flow    conditions:      - type: io.kestra.plugin.core.condition.ExecutionStatus        in:          - FAILED          - WARNING      - type: io.kestra.plugin.core.condition.ExecutionNamespace        namespace: company.analytics        prefix: true
Adding this single flow will ensure that you receive a Slack alert on any flow failure in the company.analytics namespace. Here is an example alert notification:
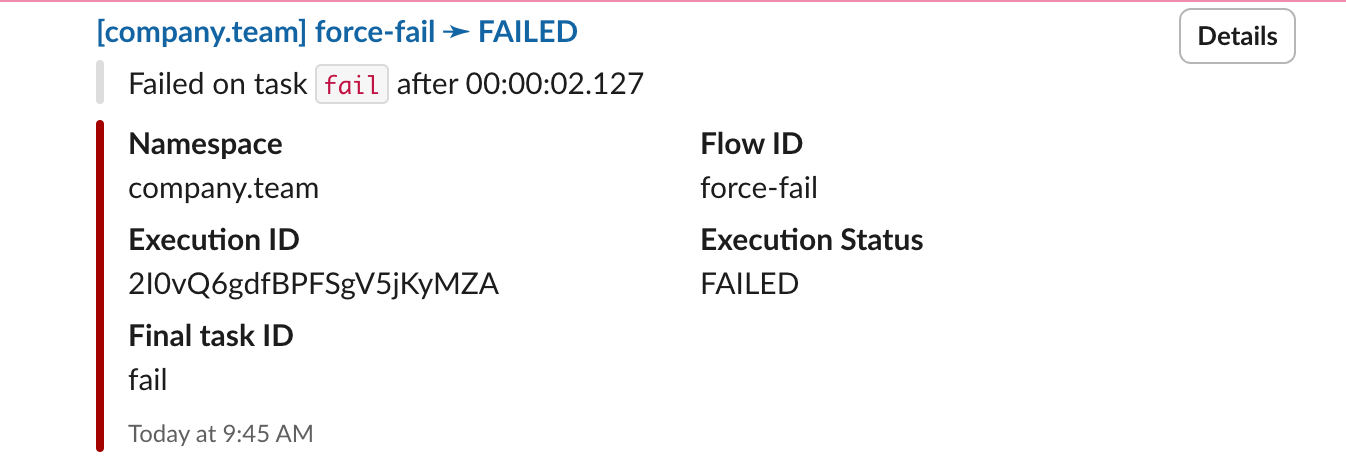
To send this alert on failure across multiple namespaces, add an OrCondition to the conditions list. See the example below:
id: alertnamespace: company.system
tasks:  - id: send    type: io.kestra.plugin.slack.notifications.SlackExecution    url: "{{ secret('SLACK_WEBHOOK') }}"    channel: "#general"    executionId: "{{trigger.executionId}}"
triggers: - id: listen type: io.kestra.plugin.core.trigger.Flow conditions: - type: io.kestra.plugin.core.condition.ExecutionStatus in: - FAILED - WARNING - type: io.kestra.plugin.core.condition.Or conditions: - type: io.kestra.plugin.core.condition.ExecutionNamespace namespace: company.product prefix: true - type: io.kestra.plugin.core.condition.ExecutionFlow flowId: cleanup namespace: company.systemThe example above works correctly. However, if you list the conditions without using OrCondition, no alerts will be sent because Kestra will try to match all conditions simultaneously. Since there’s no overlap between them, the conditions cancel each other out. See the example below:
id: bad_examplenamespace: company.monitoringdescription: This example will not work
tasks:  - id: send    type: io.kestra.plugin.slack.notifications.SlackExecution    url: "{{ secret('SLACK_WEBHOOK') }}"    channel: "#general"    executionId: "{{trigger.executionId}}"
triggers: - id: listen type: io.kestra.plugin.core.trigger.Flow conditions: - type: io.kestra.plugin.core.condition.ExecutionStatus in: - FAILED - WARNING - type: io.kestra.plugin.core.condition.ExecutionNamespace namespace: company.product prefix: true - type: io.kestra.plugin.core.condition.ExecutionFlow flowId: cleanup namespace: company.systemHere, there’s no overlap between the two conditions. The first condition will only match executions in the company.product namespace, while the second condition will only match executions from the cleanup flow in the company.system namespace. To match executions from the cleanup flow in the company.system namespace or any execution in the product namespace, use OrCondition.
Monitoring
Kestra exposes a monitoring endpoint on port 8081 by default. You can change this port using the endpoints.all.port property in the Observability and Networking configuration.
This monitoring endpoint provides invaluable information for troubleshooting and monitoring, including Prometheus metrics and several Kestra’s internal routes. For instance, the /health endpoint exposed by default on port 8081 (e.g., http://localhost:8081/health) generates a similar response as shown below as long as your Kestra instance is healthy:
{  "name": "kestra",  "status": "UP",  "details": {    "jdbc": {      "name": "kestra",      "status": "UP",      "details": {        "jdbc:postgresql://postgres:5432/kestra": {          "name": "kestra",          "status": "UP",          "details": {            "database": "PostgreSQL",            "version": "15.3 (Debian 15.3-1.pgdg110+1)"          }        }      }    },    "compositeDiscoveryClient()": {      "name": "kestra",      "status": "UP",      "details": {        "services": {
} } }, "service": { "name": "kestra", "status": "UP" }, "diskSpace": { "name": "kestra", "status": "UP", "details": { "total": 204403494912, "free": 13187035136, "threshold": 10485760 } } }}Prometheus
Kestra exposes Prometheus metrics on the endpoint /prometheus. This endpoint is compatible with Prometheus and can be scraped by any Prometheus-based monitoring system.
For more details about Prometheus setup, refer to the Monitoring with Grafana & Prometheus article.
For a complete list of available metrics, refer to the Prometheus metrics page.
Kestra’s metrics
Use Kestra’s internal metrics to configure custom alerts. Each metric provides multiple time series with tags allowing to track at least namespace & flow but also other tags depending on available tasks.
Kestra metrics use the prefix kestra. This prefix can be changed using the kestra.metrics.prefix property in the Observability and Networking configuration.
Each task type can expose custom metrics that will be also exposed on Prometheus.
Worker
| Metrics | Type | Description |
|---|---|---|
| worker.running.count | GAUGE | Number of tasks currently running |
| worker.started.count | COUNTER | Count of tasks started |
| worker.retried.count | COUNTER | Count of tasks retried |
| worker.ended.count | COUNTER | Count of tasks completed |
| worker.ended.duration | TIMER | Duration of tasks completed |
| worker.job.running | GAUGE | Count of currently running worker jobs |
| worker.job.pending | GAUGE | Count of currently pending worker jobs |
| worker.job.thread | GAUGE | Total worker job thread count |
The worker.job.pending, worker.job.running, and worker.job.thread metrics are intended for autoscaling worker servers.
Executor
| Metrics | Type | Description |
|---|---|---|
| executor.taskrun.next.count | COUNTER | Count of tasks found |
| executor.execution.end.count | COUNTER | Count of completed executions |
| executor.taskrun.ended.duration | TIMER | Duration of tasks completed |
| executor.workertaskresult.count | COUNTER | Count of task results sent by a worker |
| executor.execution.started.count | COUNTER | Count of executions started |
| executor.execution.end.count | COUNTER | Count of executions completed |
| executor.execution.duration | TIMER | Duration of executions completed |
| executor.flowable.execution.count | COUNTER | Count of flowable tasks executed |
| executor.execution.popped.count | COUNTER | Count of executions popped |
| executor.execution.queued.count | COUNTER | Count of executions queued |
| executor.thread.count | COUNTER | Count of executor threads |
Indexer
| Metrics | Type | Description |
|---|---|---|
| indexer.count | COUNTER | Count of index requests sent to a repository |
| indexer.duration | DURATION | Duration of index requests sent to a repository |
Scheduler
| Metrics | Type | Description |
|---|---|---|
| scheduler.trigger.count | COUNTER | Count of triggers |
| scheduler.evaluate.running.count | COUNTER | Evaluation of triggers actually running |
| scheduler.evaluate.duration | TIMER | Duration of trigger evaluation |
JDBC Queue
| Metrics | Type | Description |
|---|---|---|
| queue.big_message.count | COUNTER | Count of big messages |
| queue.produce.count | COUNTER | Count of produced messages |
| queue.receive.duration | TIMER | Duration to receive and consume a batch of messages |
| queue.poll.size | GAUGE | Size of a poll to the queue (message batch size) |
Other metrics
Kestra also exposes all internal metrics from the following sources:
See the Micronaut documentation for more information.
Grafana and Kibana
Kestra uses Elasticsearch to store all executions and metrics. You can create a dashboard with Grafana or Kibana to monitor the health of your Kestra instance.
Share your dashboard with the community. Below is an example Grafana dashboard you can use as a starting point:
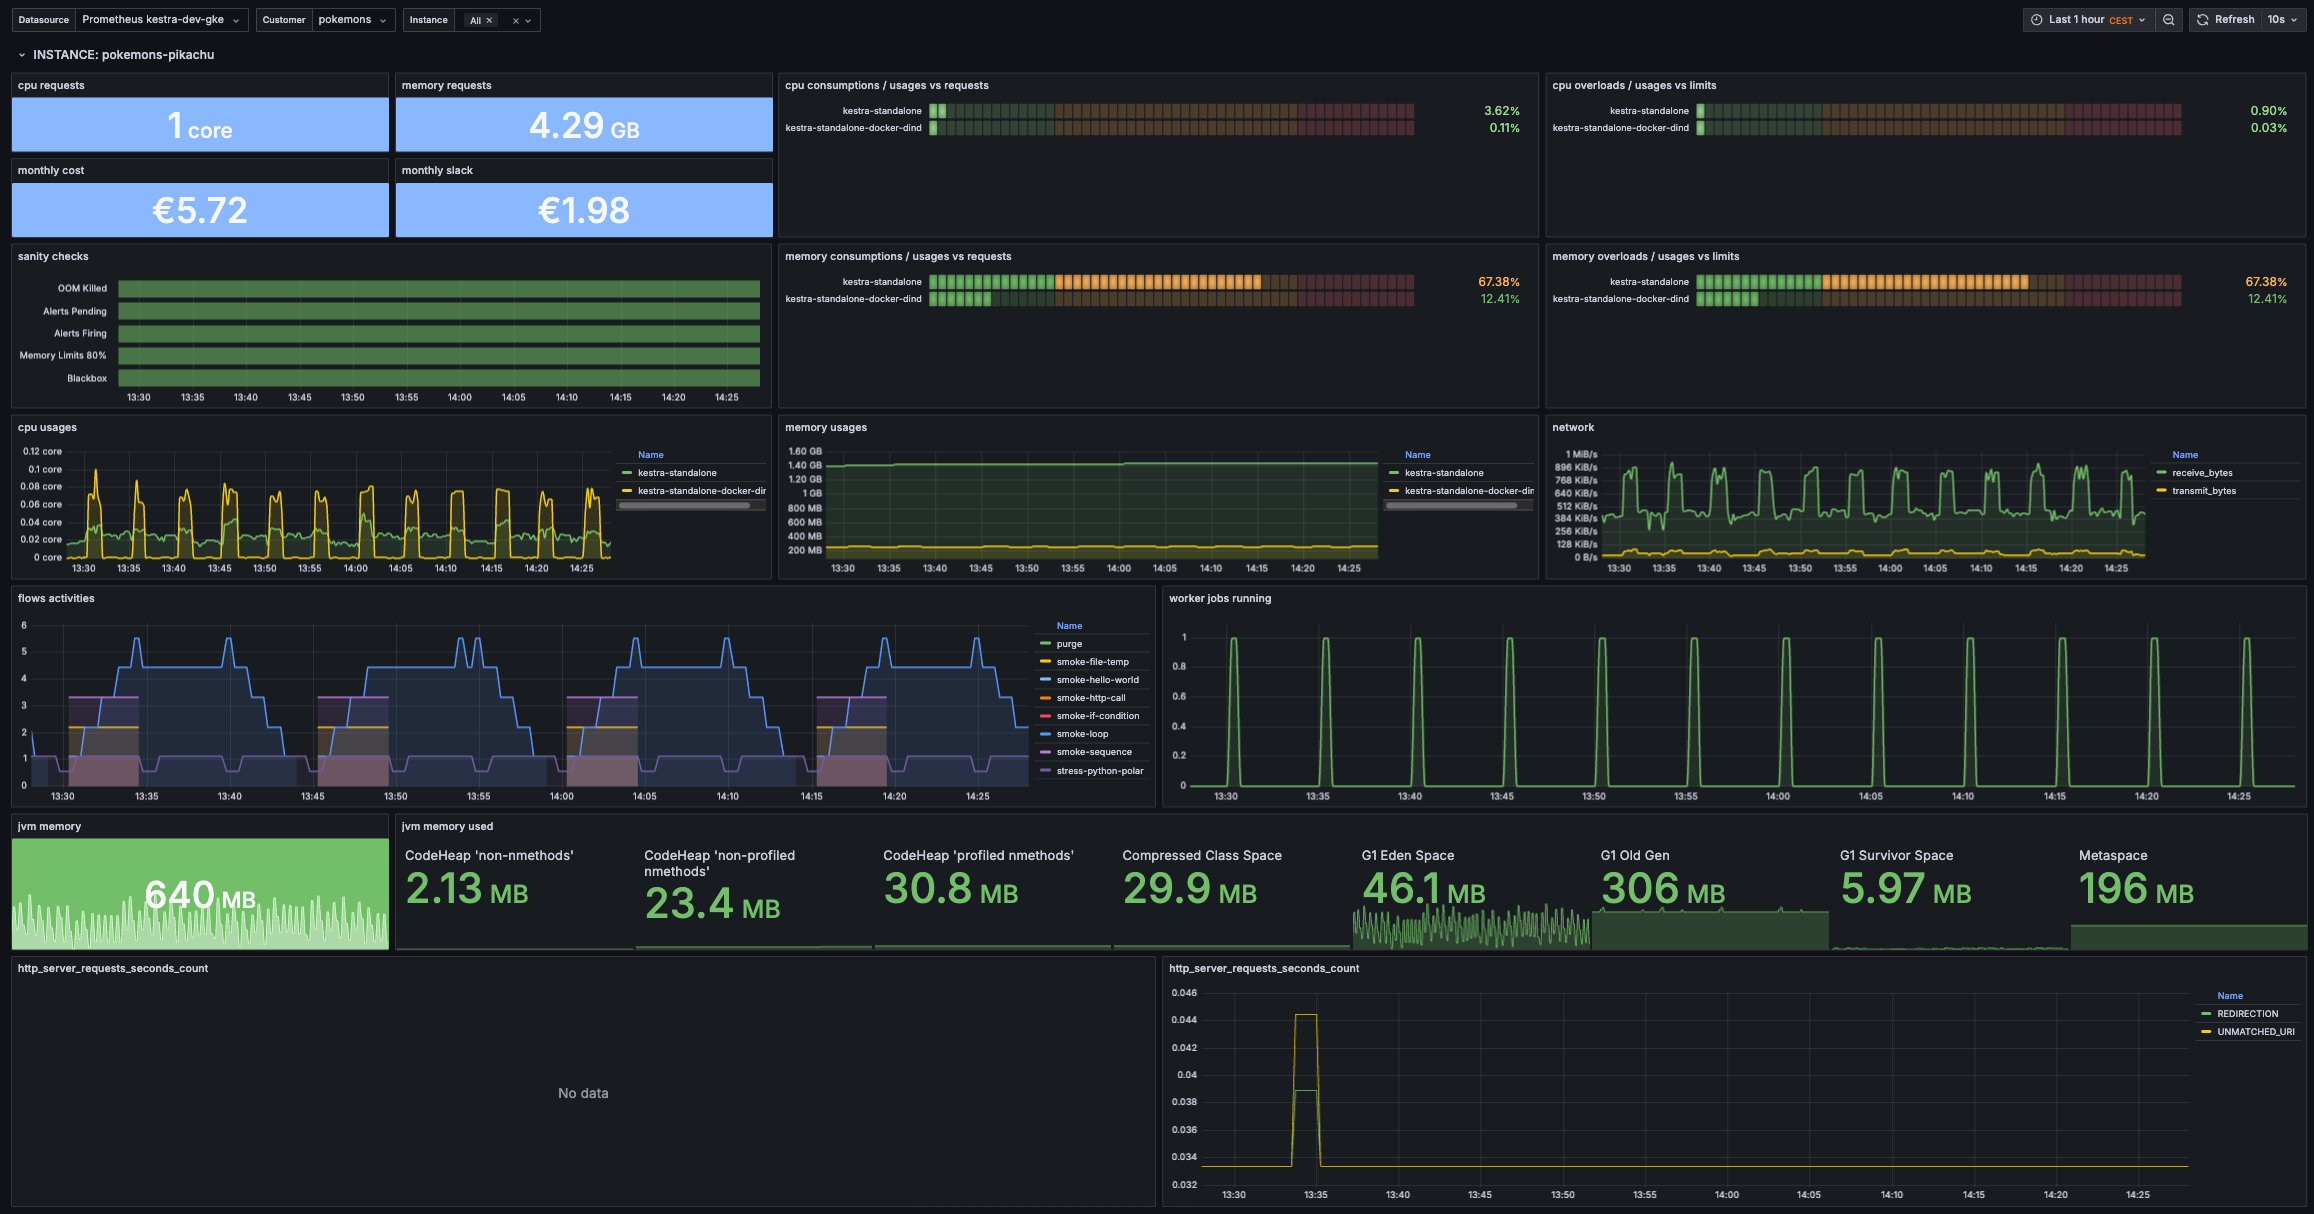
Grafana Dashboard JSON
{ "annotations": { "list": [ { "builtIn": 1, "datasource": { "type": "grafana", "uid": "-- Grafana --" }, "enable": true, "hide": true, "iconColor": "rgba(0, 211, 255, 1)", "name": "Annotations & Alerts", "type": "dashboard" } ] }, "editable": true, "fiscalYearStartMonth": 0, "graphTooltip": 0, "id": 1862, "links": [], "panels": [ { "collapsed": false, "gridPos": { "h": 1, "w": 24, "x": 0, "y": 0 }, "id": 3, "panels": [], "repeat": "namespace", "title": "INSTANCE: $namespace", "type": "row" }, { "datasource": { "type": "prometheus", "uid": "${datasource}" }, "fieldConfig": { "defaults": { "color": { "mode": "thresholds" }, "mappings": [], "thresholds": { "mode": "absolute", "steps": [ { "color": "light-blue" } ] }, "unit": "core" }, "overrides": [] }, "gridPos": { "h": 3, "w": 4, "x": 0, "y": 1 }, "id": 6, "options": { "colorMode": "background_solid", "graphMode": "area", "justifyMode": "center", "orientation": "auto", "percentChangeColorMode": "standard", "reduceOptions": { "calcs": [ "lastNotNull" ], "fields": "", "values": false }, "showPercentChange": false, "textMode": "auto", "wideLayout": true }, "pluginVersion": "12.0.1", "targets": [ { "datasource": { "type": "prometheus", "uid": "${datasource}" }, "editorMode": "code", "exemplar": false, "expr": "sum(kube_pod_container_resource_requests{namespace=\"$namespace\", resource=\"cpu\"})", "instant": true, "legendFormat": "{{container}}", "range": false, "refId": "A" } ], "title": "cpu requests", "type": "stat" }, { "datasource": { "type": "prometheus", "uid": "${datasource}" }, "fieldConfig": { "defaults": { "color": { "mode": "thresholds" }, "mappings": [], "thresholds": { "mode": "absolute", "steps": [ { "color": "light-blue" } ] }, "unit": "decbytes" }, "overrides": [] }, "gridPos": { "h": 3, "w": 4, "x": 4, "y": 1 }, "id": 5, "options": { "colorMode": "background_solid", "graphMode": "area", "justifyMode": "auto", "orientation": "auto", "percentChangeColorMode": "standard", "reduceOptions": { "calcs": [ "lastNotNull" ], "fields": "", "values": false }, "showPercentChange": false, "textMode": "auto", "wideLayout": true }, "pluginVersion": "12.0.1", "targets": [ { "datasource": { "type": "prometheus", "uid": "${datasource}" }, "editorMode": "code", "exemplar": false, "expr": "sum(kube_pod_container_resource_requests{namespace=\"$namespace\", resource=\"memory\"})", "instant": true, "legendFormat": "{{container}}", "range": false, "refId": "A" } ], "title": "memory requests", "type": "stat" }, { "datasource": { "type": "prometheus", "uid": "${datasource}" }, "fieldConfig": { "defaults": { "color": { "mode": "thresholds" }, "decimals": 2, "mappings": [], "max": 1, "min": 0, "thresholds": { "mode": "absolute", "steps": [ { "color": "light-green" }, { "color": "light-orange", "value": 0.25 }, { "color": "light-red", "value": 0.75 } ] }, "unit": "percentunit" }, "overrides": [] }, "gridPos": { "h": 6, "w": 8, "x": 8, "y": 1 }, "id": 4, "options": { "displayMode": "lcd", "legend": { "calcs": [], "displayMode": "list", "placement": "bottom", "showLegend": false }, "maxVizHeight": 20, "minVizHeight": 20, "minVizWidth": 8, "namePlacement": "auto", "orientation": "horizontal", "reduceOptions": { "calcs": [ "lastNotNull" ], "fields": "", "values": false }, "showUnfilled": true, "sizing": "manual", "text": { "titleSize": 12, "valueSize": 16 }, "valueMode": "color" }, "pluginVersion": "12.0.1", "targets": [ { "datasource": { "type": "prometheus", "uid": "${datasource}" }, "editorMode": "code", "exemplar": false, "expr": "avg(rate(container_cpu_usage_seconds_total{namespace=\"$namespace\", container!=\"\"}[2m])) by (container) / avg(kube_pod_container_resource_requests{namespace=\"$namespace\", resource=\"cpu\"}) by (container)", "instant": true, "legendFormat": "{{container}}", "range": false, "refId": "A" } ], "title": "cpu consumptions / usages vs requests", "type": "bargauge" }, { "datasource": { "type": "prometheus", "uid": "${datasource}" }, "fieldConfig": { "defaults": { "color": { "mode": "thresholds" }, "decimals": 2, "mappings": [], "max": 1, "min": 0, "thresholds": { "mode": "absolute", "steps": [ { "color": "light-green" }, { "color": "light-orange", "value": 0.25 }, { "color": "light-red", "value": 0.75 } ] }, "unit": "percentunit" }, "overrides": [] }, "gridPos": { "h": 6, "w": 8, "x": 16, "y": 1 }, "id": 12, "options": { "displayMode": "lcd", "legend": { "calcs": [], "displayMode": "list", "placement": "bottom", "showLegend": false }, "maxVizHeight": 20, "minVizHeight": 20, "minVizWidth": 8, "namePlacement": "auto", "orientation": "horizontal", "reduceOptions": { "calcs": [ "lastNotNull" ], "fields": "", "values": false }, "showUnfilled": true, "sizing": "manual", "text": { "titleSize": 12, "valueSize": 16 }, "valueMode": "color" }, "pluginVersion": "12.0.1", "targets": [ { "datasource": { "type": "prometheus", "uid": "${datasource}" }, "editorMode": "code", "exemplar": false, "expr": "avg(rate(container_cpu_usage_seconds_total{namespace=\"$namespace\", container!=\"\"}[2m])) by (container) / avg(kube_pod_container_resource_limits{namespace=\"$namespace\", resource=\"cpu\"}) by (container)", "instant": true, "legendFormat": "{{container}}", "range": false, "refId": "A" } ], "title": "cpu overloads / usages vs limits", "type": "bargauge" }, { "datasource": { "type": "prometheus", "uid": "${datasource}" }, "fieldConfig": { "defaults": { "color": { "mode": "thresholds" }, "mappings": [], "thresholds": { "mode": "absolute", "steps": [ { "color": "light-blue" } ] }, "unit": "currencyEUR" }, "overrides": [] }, "gridPos": { "h": 3, "w": 4, "x": 0, "y": 4 }, "id": 16, "options": { "colorMode": "background_solid", "graphMode": "area", "justifyMode": "center", "orientation": "auto", "percentChangeColorMode": "standard", "reduceOptions": { "calcs": [ "lastNotNull" ], "fields": "", "values": false }, "showPercentChange": false, "textMode": "auto", "wideLayout": true }, "pluginVersion": "12.0.1", "targets": [ { "datasource": { "type": "prometheus", "uid": "${datasource}" }, "editorMode": "code", "exemplar": false, "expr": "monthly_namespace_cost{exported_namespace=\"$namespace\"}", "instant": true, "legendFormat": "{{container}}", "range": false, "refId": "A" } ], "title": "monthly cost", "type": "stat" }, { "datasource": { "type": "prometheus", "uid": "${datasource}" }, "fieldConfig": { "defaults": { "color": { "mode": "thresholds" }, "mappings": [], "thresholds": { "mode": "absolute", "steps": [ { "color": "light-blue" } ] }, "unit": "currencyEUR" }, "overrides": [] }, "gridPos": { "h": 3, "w": 4, "x": 4, "y": 4 }, "id": 17, "options": { "colorMode": "background_solid", "graphMode": "area", "justifyMode": "center", "orientation": "auto", "percentChangeColorMode": "standard", "reduceOptions": { "calcs": [ "lastNotNull" ], "fields": "", "values": false }, "showPercentChange": false, "textMode": "auto", "wideLayout": true }, "pluginVersion": "12.0.1", "targets": [ { "datasource": { "type": "prometheus", "uid": "${datasource}" }, "editorMode": "code", "exemplar": false, "expr": "monthly_namespace_slack{exported_namespace=\"$namespace\"}", "instant": true, "legendFormat": "{{container}}", "range": false, "refId": "A" } ], "title": "monthly slack", "type": "stat" }, { "datasource": { "type": "prometheus", "uid": "${datasource}" }, "fieldConfig": { "defaults": { "color": { "mode": "thresholds" }, "custom": { "axisPlacement": "auto", "fillOpacity": 50, "hideFrom": { "legend": false, "tooltip": false, "viz": false }, "insertNulls": false, "lineWidth": 0, "spanNulls": false }, "mappings": [], "thresholds": { "mode": "absolute", "steps": [ { "color": "green" }, { "color": "red", "value": 1 } ] } }, "overrides": [] }, "gridPos": { "h": 6, "w": 8, "x": 0, "y": 7 }, "id": 8, "options": { "alignValue": "left", "legend": { "displayMode": "list", "placement": "bottom", "showLegend": false }, "mergeValues": true, "rowHeight": 0.8, "showValue": "never", "tooltip": { "hideZeros": false, "mode": "single", "sort": "none" } }, "pluginVersion": "12.0.1", "targets": [ { "datasource": { "type": "prometheus", "uid": "${datasource}" }, "editorMode": "code", "expr": "count(kube_pod_container_status_last_terminated_reason{reason=\"OOMKilled\", namespace=\"$namespace\"}) or vector(0)", "legendFormat": "OOM Killed", "range": true, "refId": "OOMKilled" }, { "datasource": { "type": "prometheus", "uid": "${datasource}" }, "editorMode": "code", "expr": "count(ALERTS{alertstate=\"pending\", namespace=\"$namespace\"}) or vector(0)", "hide": false, "instant": false, "legendFormat": "Alerts Pending", "range": true, "refId": "Alerts Pending" }, { "datasource": { "type": "prometheus", "uid": "${datasource}" }, "editorMode": "code", "expr": "count(ALERTS{alertstate=\"firing\", namespace=\"$namespace\"}) or vector(0)", "hide": false, "instant": false, "legendFormat": "Alerts Firing", "range": true, "refId": "Alerts Firing" }, { "datasource": { "type": "prometheus", "uid": "${datasource}" }, "editorMode": "code", "expr": "count(avg(container_memory_usage_bytes{namespace=\"$namespace\", container!=\"\"}) by (container) / avg(kube_pod_container_resource_limits{namespace=\"$namespace\", resource=\"memory\"}) by (container) > 0.8) or vector(0)", "hide": false, "instant": false, "legendFormat": "Memory Limits 80%", "range": true, "refId": "Memory Limits" }, { "datasource": { "type": "prometheus", "uid": "${datasource}" }, "editorMode": "code", "expr": "count(ALERTS{alertname=\"ProbesStatusError\", alertstate=\"firing\", job=\"blackbox-$namespace\"} == 1) or vector(0)", "hide": false, "instant": false, "legendFormat": "Blackbox", "range": true, "refId": "Blackbox" } ], "title": "sanity checks", "type": "state-timeline" }, { "datasource": { "type": "prometheus", "uid": "${datasource}" }, "fieldConfig": { "defaults": { "color": { "mode": "thresholds" }, "decimals": 2, "mappings": [], "max": 1, "min": 0, "thresholds": { "mode": "absolute", "steps": [ { "color": "green" }, { "color": "light-orange", "value": 0.25 }, { "color": "light-red", "value": 0.75 } ] }, "unit": "percentunit" }, "overrides": [] }, "gridPos": { "h": 6, "w": 8, "x": 8, "y": 7 }, "id": 7, "options": { "displayMode": "lcd", "legend": { "calcs": [], "displayMode": "list", "placement": "bottom", "showLegend": false }, "maxVizHeight": 20, "minVizHeight": 20, "minVizWidth": 8, "namePlacement": "auto", "orientation": "horizontal", "reduceOptions": { "calcs": [ "lastNotNull" ], "fields": "", "values": false }, "showUnfilled": true, "sizing": "manual", "text": { "titleSize": 12, "valueSize": 16 }, "valueMode": "color" }, "pluginVersion": "12.0.1", "targets": [ { "datasource": { "type": "prometheus", "uid": "${datasource}" }, "editorMode": "code", "exemplar": false, "expr": "avg(container_memory_usage_bytes{namespace=\"$namespace\", container!=\"\"}) by (container) / avg(kube_pod_container_resource_requests{namespace=\"$namespace\", resource=\"memory\"}) by (container)", "instant": true, "legendFormat": "{{container}}", "range": false, "refId": "A" } ], "title": "memory consumptions / usages vs requests", "type": "bargauge" }, { "datasource": { "type": "prometheus", "uid": "${datasource}" }, "fieldConfig": { "defaults": { "color": { "mode": "thresholds" }, "decimals": 2, "mappings": [], "max": 1, "min": 0, "thresholds": { "mode": "absolute", "steps": [ { "color": "green" }, { "color": "light-orange", "value": 0.25 }, { "color": "light-red", "value": 0.75 } ] }, "unit": "percentunit" }, "overrides": [] }, "gridPos": { "h": 6, "w": 8, "x": 16, "y": 7 }, "id": 10, "options": { "displayMode": "lcd", "legend": { "calcs": [], "displayMode": "list", "placement": "bottom", "showLegend": false }, "maxVizHeight": 20, "minVizHeight": 20, "minVizWidth": 8, "namePlacement": "auto", "orientation": "horizontal", "reduceOptions": { "calcs": [ "lastNotNull" ], "fields": "", "values": false }, "showUnfilled": true, "sizing": "manual", "text": { "titleSize": 12, "valueSize": 16 }, "valueMode": "color" }, "pluginVersion": "12.0.1", "targets": [ { "datasource": { "type": "prometheus", "uid": "${datasource}" }, "editorMode": "code", "exemplar": false, "expr": "avg(container_memory_usage_bytes{namespace=\"$namespace\", container!=\"\"}) by (container) / avg(kube_pod_container_resource_limits{namespace=\"$namespace\", resource=\"memory\"}) by (container)", "instant": true, "legendFormat": "{{container}}", "range": false, "refId": "A" } ], "title": "memory overloads / usages vs limits", "type": "bargauge" }, { "datasource": { "type": "prometheus", "uid": "${datasource}" }, "fieldConfig": { "defaults": { "color": { "mode": "palette-classic" }, "custom": { "axisBorderShow": false, "axisCenteredZero": false, "axisColorMode": "text", "axisLabel": "", "axisPlacement": "auto", "barAlignment": 0, "barWidthFactor": 0.6, "drawStyle": "line", "fillOpacity": 10, "gradientMode": "none", "hideFrom": { "legend": false, "tooltip": false, "viz": false }, "insertNulls": false, "lineInterpolation": "smooth", "lineWidth": 2, "pointSize": 5, "scaleDistribution": { "type": "linear" }, "showPoints": "auto", "spanNulls": false, "stacking": { "group": "A", "mode": "none" }, "thresholdsStyle": { "mode": "off" } }, "mappings": [], "thresholds": { "mode": "absolute", "steps": [ { "color": "green" } ] }, "unit": "core" }, "overrides": [] }, "gridPos": { "h": 6, "w": 8, "x": 0, "y": 13 }, "id": 2, "options": { "legend": { "calcs": [], "displayMode": "table", "placement": "right", "showLegend": true, "width": 200 }, "tooltip": { "hideZeros": false, "mode": "single", "sort": "none" } }, "pluginVersion": "12.0.1", "targets": [ { "datasource": { "type": "prometheus", "uid": "${datasource}" }, "editorMode": "code", "expr": "avg(rate(container_cpu_usage_seconds_total{namespace=\"$namespace\", container!=\"\", pod!~\"^app-bootstrap.*\"}[2m])) by (container)", "legendFormat": "{{container}}", "range": true, "refId": "A" } ], "title": "cpu usages", "type": "timeseries" }, { "datasource": { "type": "prometheus", "uid": "${datasource}" }, "fieldConfig": { "defaults": { "color": { "mode": "palette-classic" }, "custom": { "axisBorderShow": false, "axisCenteredZero": false, "axisColorMode": "text", "axisLabel": "", "axisPlacement": "auto", "barAlignment": 0, "barWidthFactor": 0.6, "drawStyle": "line", "fillOpacity": 10, "gradientMode": "none", "hideFrom": { "legend": false, "tooltip": false, "viz": false }, "insertNulls": false, "lineInterpolation": "smooth", "lineWidth": 2, "pointSize": 5, "scaleDistribution": { "type": "linear" }, "showPoints": "auto", "spanNulls": false, "stacking": { "group": "A", "mode": "none" }, "thresholdsStyle": { "mode": "off" } }, "mappings": [], "thresholds": { "mode": "absolute", "steps": [ { "color": "green" }, { "color": "red", "value": 80 } ] }, "unit": "decbytes" }, "overrides": [] }, "gridPos": { "h": 6, "w": 8, "x": 8, "y": 13 }, "id": 1, "options": { "legend": { "calcs": [], "displayMode": "table", "placement": "right", "showLegend": true, "width": 200 }, "tooltip": { "hideZeros": false, "mode": "single", "sort": "none" } }, "pluginVersion": "12.0.1", "targets": [ { "datasource": { "type": "prometheus", "uid": "${datasource}" }, "editorMode": "code", "expr": "avg(container_memory_usage_bytes{namespace=\"$namespace\", container!=\"\", container!=\"certresolver\", pod!~\"^app-bootstrap.*\"}) by (namespace, container)", "legendFormat": "{{container}}", "range": true, "refId": "A" } ], "title": "memory usages", "type": "timeseries" }, { "datasource": { "type": "prometheus", "uid": "${datasource}" }, "fieldConfig": { "defaults": { "color": { "mode": "palette-classic" }, "custom": { "axisBorderShow": false, "axisCenteredZero": false, "axisColorMode": "text", "axisLabel": "", "axisPlacement": "auto", "barAlignment": 0, "barWidthFactor": 0.6, "drawStyle": "line", "fillOpacity": 10, "gradientMode": "none", "hideFrom": { "legend": false, "tooltip": false, "viz": false }, "insertNulls": false, "lineInterpolation": "smooth", "lineWidth": 2, "pointSize": 5, "scaleDistribution": { "type": "linear" }, "showPoints": "auto", "spanNulls": false, "stacking": { "group": "A", "mode": "none" }, "thresholdsStyle": { "mode": "off" } }, "mappings": [], "thresholds": { "mode": "absolute", "steps": [ { "color": "green" } ] }, "unit": "binBps" }, "overrides": [] }, "gridPos": { "h": 6, "w": 8, "x": 16, "y": 13 }, "id": 13, "options": { "legend": { "calcs": [], "displayMode": "table", "placement": "right", "showLegend": true, "width": 200 }, "tooltip": { "hideZeros": false, "mode": "single", "sort": "none" } }, "pluginVersion": "12.0.1", "targets": [ { "datasource": { "type": "prometheus", "uid": "${datasource}" }, "editorMode": "code", "expr": "avg by (namespace) (\n rate(container_network_receive_bytes_total{namespace=\"$namespace\"}[2m])\n * on (namespace,pod) group_left ()\n topk by (namespace,pod) (\n 1,\n max by (namespace,pod) (kube_pod_info{host_network=\"false\"})\n )\n)", "legendFormat": "receive_bytes", "range": true, "refId": "receive_bytes" }, { "datasource": { "type": "prometheus", "uid": "${datasource}" }, "editorMode": "code", "expr": "avg by (namespace) (\n rate(container_network_transmit_bytes_total{namespace=\"$namespace\"}[2m])\n * on (namespace,pod) group_left ()\n topk by (namespace,pod) (\n 1,\n max by (namespace,pod) (kube_pod_info{host_network=\"false\"})\n )\n)", "hide": false, "instant": false, "legendFormat": "transmit_bytes", "range": true, "refId": "transmit_bytes" } ], "title": "network", "type": "timeseries" }, { "datasource": { "type": "prometheus", "uid": "${datasource}" }, "fieldConfig": { "defaults": { "color": { "mode": "palette-classic" }, "custom": { "axisBorderShow": false, "axisCenteredZero": false, "axisColorMode": "text", "axisLabel": "", "axisPlacement": "auto", "barAlignment": 0, "barWidthFactor": 0.6, "drawStyle": "line", "fillOpacity": 10, "gradientMode": "none", "hideFrom": { "legend": false, "tooltip": false, "viz": false }, "insertNulls": false, "lineInterpolation": "linear", "lineStyle": { "fill": "solid" }, "lineWidth": 2, "pointSize": 5, "scaleDistribution": { "type": "linear" }, "showPoints": "auto", "spanNulls": false, "stacking": { "group": "A", "mode": "none" }, "thresholdsStyle": { "mode": "off" } }, "mappings": [], "thresholds": { "mode": "absolute", "steps": [ { "color": "light-green" } ] }, "unit": "none" }, "overrides": [] }, "gridPos": { "h": 8, "w": 12, "x": 0, "y": 19 }, "id": 14, "options": { "legend": { "calcs": [], "displayMode": "table", "placement": "right", "showLegend": true }, "tooltip": { "hideZeros": false, "mode": "single", "sort": "none" } }, "pluginVersion": "12.0.1", "targets": [ { "datasource": { "type": "prometheus", "uid": "${datasource}" }, "editorMode": "code", "expr": "avg(increase(kestra_worker_ended_duration_seconds_count{namespace=\"$namespace\"}[5m])) by (flow_id) > 0", "legendFormat": "{{ flow_id }}", "range": true, "refId": "indexer_message_in_count" } ], "title": "flows activities", "type": "timeseries" }, { "datasource": { "type": "prometheus", "uid": "${datasource}" }, "fieldConfig": { "defaults": { "color": { "mode": "palette-classic" }, "custom": { "axisBorderShow": false, "axisCenteredZero": false, "axisColorMode": "text", "axisLabel": "", "axisPlacement": "auto", "barAlignment": 0, "barWidthFactor": 0.6, "drawStyle": "line", "fillOpacity": 10, "gradientMode": "none", "hideFrom": { "legend": false, "tooltip": false, "viz": false }, "insertNulls": false, "lineInterpolation": "smooth", "lineWidth": 2, "pointSize": 5, "scaleDistribution": { "type": "linear" }, "showPoints": "auto", "spanNulls": false, "stacking": { "group": "A", "mode": "none" }, "thresholdsStyle": { "mode": "off" } }, "mappings": [], "thresholds": { "mode": "absolute", "steps": [ { "color": "light-green" } ] }, "unit": "none" }, "overrides": [] }, "gridPos": { "h": 8, "w": 12, "x": 12, "y": 19 }, "id": 20, "options": { "legend": { "calcs": [], "displayMode": "list", "placement": "bottom", "showLegend": false }, "tooltip": { "hideZeros": false, "mode": "single", "sort": "none" } }, "pluginVersion": "12.0.1", "targets": [ { "datasource": { "type": "prometheus", "uid": "${datasource}" }, "editorMode": "code", "expr": "sum(kestra_worker_job_running{namespace=\"$namespace\"})", "legendFormat": "{{ flow_id }}", "range": true, "refId": "indexer_message_in_count" } ], "title": "worker jobs running", "type": "timeseries" }, { "datasource": { "type": "prometheus", "uid": "${datasource}" }, "fieldConfig": { "defaults": { "color": { "mode": "thresholds" }, "mappings": [], "thresholds": { "mode": "absolute", "steps": [ { "color": "green" } ] }, "unit": "decbytes" }, "overrides": [] }, "gridPos": { "h": 5, "w": 4, "x": 0, "y": 27 }, "id": 19, "options": { "colorMode": "background_solid", "graphMode": "area", "justifyMode": "center", "orientation": "auto", "percentChangeColorMode": "standard", "reduceOptions": { "calcs": [ "lastNotNull" ], "fields": "", "values": false }, "showPercentChange": false, "textMode": "auto", "wideLayout": true }, "pluginVersion": "12.0.1", "targets": [ { "datasource": { "type": "prometheus", "uid": "${datasource}" }, "editorMode": "code", "expr": "sum(jvm_memory_used_bytes{namespace=\"$namespace\"})", "hide": false, "instant": false, "legendFormat": "__auto", "range": true, "refId": "A" } ], "title": "jvm memory", "type": "stat" }, { "datasource": { "type": "prometheus", "uid": "${datasource}" }, "fieldConfig": { "defaults": { "color": { "mode": "thresholds" }, "mappings": [], "thresholds": { "mode": "absolute", "steps": [ { "color": "green" } ] }, "unit": "decbytes" }, "overrides": [] }, "gridPos": { "h": 5, "w": 20, "x": 4, "y": 27 }, "id": 18, "options": { "colorMode": "value", "graphMode": "area", "justifyMode": "auto", "orientation": "auto", "percentChangeColorMode": "standard", "reduceOptions": { "calcs": [ "lastNotNull" ], "fields": "", "values": false }, "showPercentChange": false, "textMode": "auto", "wideLayout": true }, "pluginVersion": "12.0.1", "targets": [ { "datasource": { "type": "prometheus", "uid": "${datasource}" }, "editorMode": "code", "expr": "avg(jvm_memory_used_bytes{namespace=\"$namespace\"}) by (id)", "hide": false, "instant": false, "legendFormat": "__auto", "range": true, "refId": "A" } ], "title": "jvm memory used", "type": "stat" }, { "datasource": { "type": "prometheus", "uid": "${datasource}" }, "fieldConfig": { "defaults": { "color": { "mode": "palette-classic" }, "custom": { "axisBorderShow": false, "axisCenteredZero": false, "axisColorMode": "text", "axisLabel": "", "axisPlacement": "auto", "barAlignment": 0, "barWidthFactor": 0.6, "drawStyle": "line", "fillOpacity": 0, "gradientMode": "none", "hideFrom": { "legend": false, "tooltip": false, "viz": false }, "insertNulls": false, "lineInterpolation": "linear", "lineWidth": 1, "pointSize": 5, "scaleDistribution": { "type": "linear" }, "showPoints": "auto", "spanNulls": false, "stacking": { "group": "A", "mode": "none" }, "thresholdsStyle": { "mode": "off" } }, "mappings": [], "thresholds": { "mode": "absolute", "steps": [ { "color": "green" }, { "color": "red", "value": 80 } ] } }, "overrides": [] }, "gridPos": { "h": 9, "w": 12, "x": 0, "y": 32 }, "id": 21, "options": { "legend": { "calcs": [], "displayMode": "table", "placement": "right", "showLegend": true }, "tooltip": { "hideZeros": false, "mode": "single", "sort": "none" } }, "pluginVersion": "12.0.1", "targets": [ { "editorMode": "code", "expr": "avg(rate(http_server_requests_seconds_count{namespace=\"$namespace\", uri!~\"(UNMATCHED_URI|REDIRECTION|/health|/prometheus|/health/{selector})\"}[2m])) by (uri)", "legendFormat": "__auto", "range": true, "refId": "A" } ], "title": "http_server_requests_seconds_count", "type": "timeseries" }, { "datasource": { "type": "prometheus", "uid": "${datasource}" }, "fieldConfig": { "defaults": { "color": { "mode": "palette-classic" }, "custom": { "axisBorderShow": false, "axisCenteredZero": false, "axisColorMode": "text", "axisLabel": "", "axisPlacement": "auto", "barAlignment": 0, "barWidthFactor": 0.6, "drawStyle": "line", "fillOpacity": 0, "gradientMode": "none", "hideFrom": { "legend": false, "tooltip": false, "viz": false }, "insertNulls": false, "lineInterpolation": "linear", "lineWidth": 1, "pointSize": 5, "scaleDistribution": { "type": "linear" }, "showPoints": "auto", "spanNulls": false, "stacking": { "group": "A", "mode": "none" }, "thresholdsStyle": { "mode": "off" } }, "mappings": [], "thresholds": { "mode": "absolute", "steps": [ { "color": "green" }, { "color": "red", "value": 80 } ] } }, "overrides": [] }, "gridPos": { "h": 9, "w": 12, "x": 12, "y": 32 }, "id": 22, "options": { "legend": { "calcs": [], "displayMode": "table", "placement": "right", "showLegend": true }, "tooltip": { "hideZeros": false, "mode": "single", "sort": "none" } }, "pluginVersion": "12.0.1", "targets": [ { "editorMode": "code", "expr": "avg(rate(http_server_requests_seconds_count{namespace=\"$namespace\", uri=~\"(REDIRECTION|UNMATCHED_URI)\"}[2m])) by (uri)", "legendFormat": "__auto", "range": true, "refId": "A" } ], "title": "http_server_requests_seconds_count", "type": "timeseries" } ], "preload": false, "refresh": "10s", "schemaVersion": 41, "tags": [], "templating": { "list": [ { "current": { "text": "Prometheus Sample", "value": "Prometheus Sample" }, "label": "Datasource", "name": "datasource", "options": [ { "selected": false, "text": "Prometheus Sample 1", "value": "Prometheus Sample 1" }, { "selected": false, "text": "Prometheus Sample 2", "value": "Prometheus Sample 2" }, { "selected": true, "text": "Prometheus Sample", "value": "Prometheus Sample" } ], "query": "Prometheus Sample 1,Prometheus Sample 2,Prometheus Sample", "type": "custom" }, { "current": { "text": "kestra", "value": "kestra" }, "datasource": { "type": "prometheus", "uid": "${datasource}" }, "definition": "label_values(kestra_jdbc_query_duration_seconds_count,kestra_instance)", "includeAll": false, "label": "KestraServer", "name": "KestraServer", "options": [], "query": { "qryType": 1, "query": "label_values(kestra_jdbc_query_duration_seconds_count,kestra_instance)", "refId": "PrometheusVariableQueryEditor-VariableQuery" }, "refresh": 1, "regex": "", "type": "query" }, { "current": { "text": "All", "value": [ "$__all" ] }, "datasource": { "type": "prometheus", "uid": "${datasource}" }, "definition": "label_values(kestra_jdbc_query_duration_seconds_count{kestra_instance=\"$KestraServer\"},kestra_cloud_instance_name)", "includeAll": true, "label": "Instance", "multi": true, "name": "instance", "options": [], "query": { "qryType": 1, "query": "label_values(kestra_jdbc_query_duration_seconds_count{kestra_instance=\"$KestraServer\"},kestra_cloud_instance_name)", "refId": "PrometheusVariableQueryEditor-VariableQuery" }, "refresh": 1, "regex": "", "type": "query" }, { "current": { "text": "All", "value": "$__all" }, "datasource": { "type": "prometheus", "uid": "${datasource}" }, "definition": "label_values(kestra_jdbc_query_duration_seconds_count{kestra_instance=~\"$KestraServer\", kestra_cloud_instance_name=~\"$instance\"},namespace)", "hide": 2, "includeAll": true, "label": "Namespace", "multi": true, "name": "namespace", "options": [], "query": { "qryType": 1, "query": "label_values(kestra_jdbc_query_duration_seconds_count{kestra_instance=~\"$KestraServer\", kestra_cloud_instance_name=~\"$instance\"},namespace)", "refId": "PrometheusVariableQueryEditor-VariableQuery" }, "refresh": 1, "regex": "", "type": "query" } ] }, "time": { "from": "now-1h", "to": "now" }, "timepicker": {}, "timezone": "UTC", "title": "Sample Kestra Dashboard", "uid": "sample_dashboard_uid", "version": 1}Kestra endpoints
Kestra exposes internal endpoints on the management port (8081 by default) to provide status corresponding to the server type:
/worker: will expose all currently running tasks on this worker./scheduler: will expose all currently scheduled flows on this scheduler with the next date./kafkastreams: will expose all Kafka Streams states and aggregated store lag./kafkastreams/{clientId}/lag: will expose details lag for aclientId./kafkastreams/{clientId}/metrics: will expose details metrics for aclientId.
Other Micronaut default endpoints
Since Kestra is based on Micronaut, the default Micronaut endpoints are enabled by default on port 8081:
/infoInfo Endpoint with git status information./healthHealth Endpoint usable as an external heathcheck for the application./loggersLoggers Endpoint allows changing logger level at runtime./metricsMetrics Endpoint metrics in JSON format./envEnvironment Endpoint to debug configuration files.
You can disable some endpoints following the above Micronaut configuration.
Debugging techniques
Here are several debugging techniques administrators can use to investigate issues:
Enable verbose log
Kestra has some management endpoints including one that allows changing logging verbosity at run time.
Inside the container (or locally if standalone jar is used), send this command to enable very verbose logging:
curl -i -X POST -H "Content-Type: application/json" \ -d '{ "configuredLevel": "TRACE" }' \ http://localhost:8081/loggers/io.kestraAlternatively, you can change logging levels on configuration files:
logger: levels: io.kestra.core.runners: TRACECapture some java dump
Kestra runs on a JRE rather than a JDK, so JVM monitoring tools are not included. Install Jattach first:
Jattach is included in the Kestra image, so there is no need to install it separately. If you’re running an older version, continue to follow the steps below.
curl -L -o jattach https://github.com/jattach/jattach/releases/download/v2.2/jattachchmod +x jattach- You need to find the pid of the Kestra process, it’s usually
1on docker installation. - You can get JVM information with
jattach <pid> jcmd VM.info > vminfo - You can get a heap history via
jattach <pid> inspectheap > inspectheap - You can get a heap dump via
jattach <pid> dumpheap > dumpheap - You can get a thread dump via
jattach <pid> threaddump > threaddump
Alternatively, you can request a thread dump via the /threaddump endpoint available on the management port (8081 if not configured otherwise).
Was this page helpful?