Monitor Kestra with Prometheus Metrics and Grafana Dashboards
For the complete documentation index, see llms.txt. For a full content snapshot, see llms-full.txt. Append.mdto anykestra.io/docs/*URL for plain Markdown.
Set up Prometheus and Grafana for monitoring Kestra.
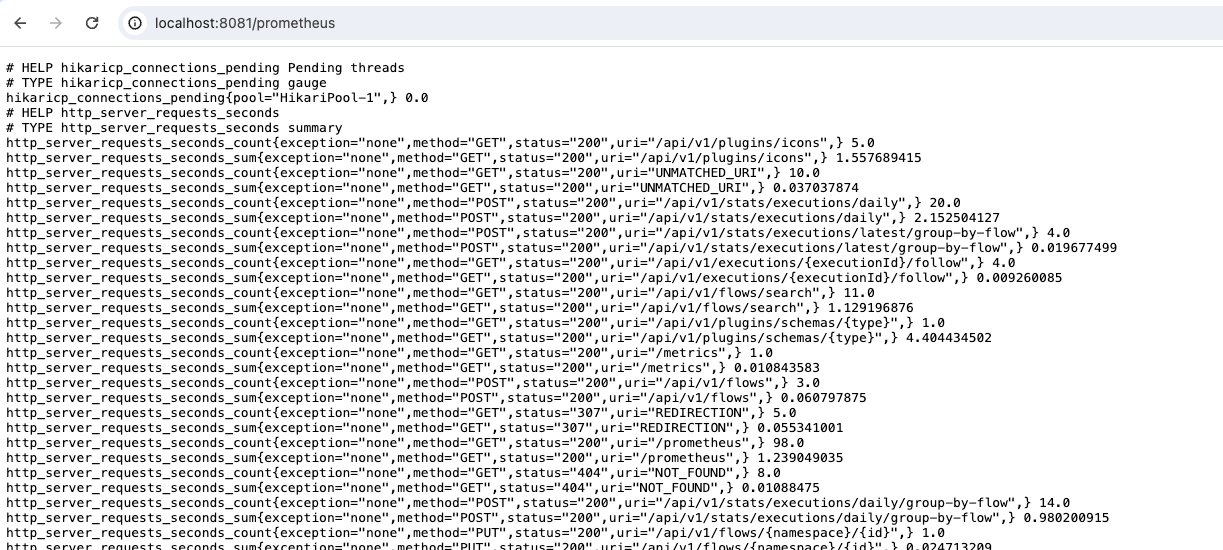
Kestra exposes Prometheus metrics at port 8081 on the endpoint /prometheus. This endpoint can be used by any compatible monitoring system.
Use the docker-compose.yml file and start Kestra using the command:
docker compose upOnce Kestra is up and running, view the available metrics at http://localhost:8081/prometheus in your browser. The metrics should appear as below:
Create a few flows and execute them to generate some metrics for visualization. You can also add triggers to the flows to check the metrics corresponding to executions happening on a regular basis.
Setting up Prometheus
With metrics available from Kestra, set up a Prometheus server to scrape them and store them in a time-series DB.
Create a prometheus.yml file for scraping the metrics:
global:  scrape_interval: 15s  evaluation_interval: 15s
scrape_configs:  - job_name: "prometheus"    metrics_path: /prometheus    static_configs:      - targets: ["<kestra-host-ip-address>:8081"]
Be sure to put the appropriate <kestra-host-ip-address> in the last line, e.g. localhost:8081 or host.docker.internal:8081.
If you’re running everything in Docker on the same machine, you will need to change your host address to host.docker.internal rather than localhost.
We can start the Prometheus server using the following docker command in the same directory as prometheus.yml:
docker run -d -p 9090:9090 -v ./prometheus.yml:/etc/prometheus/prometheus.yml prom/prometheusNote, in this last command you may have to add --add-host=host.docker.internal:host-gateway to ensure your Prometheus endpoint is shown as UP (you can check it in the targets).
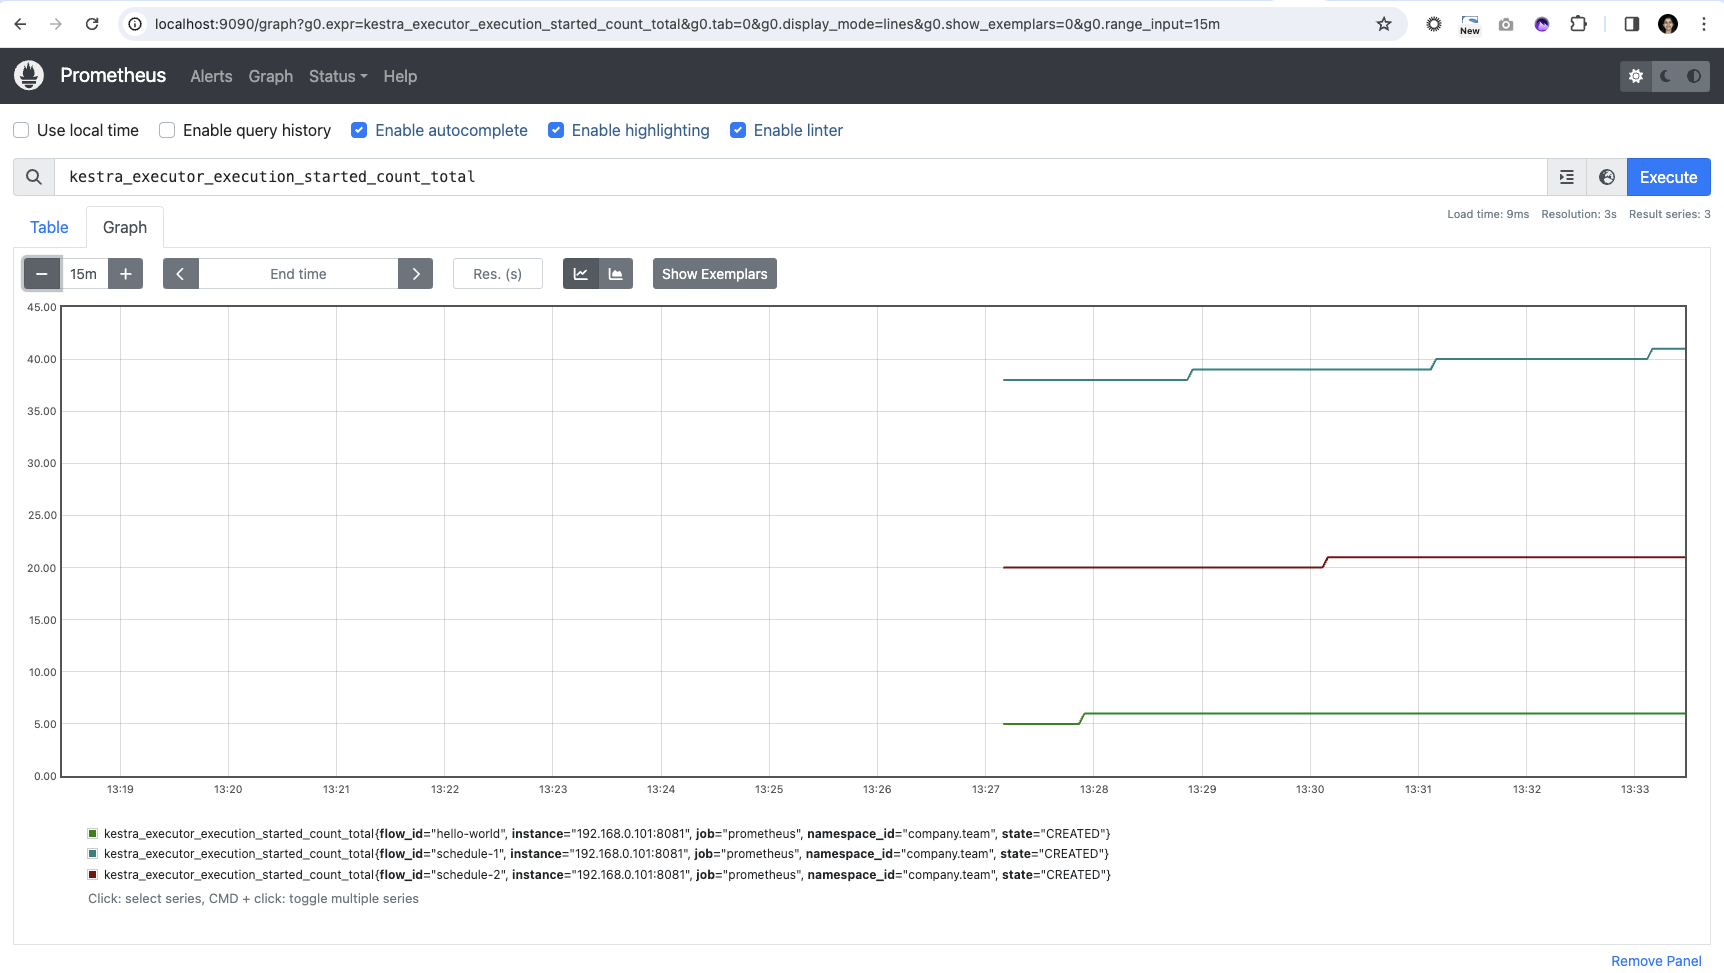
You can now go to http://localhost:9090/graph and try out visualizing some metrics using the PromQL. Here is one of the graphs for kestra_executor_execution_started_count_total metric:
Setting up Grafana
Let us now move on to setting up Grafana. You start by installing Grafana using docker via the following command:
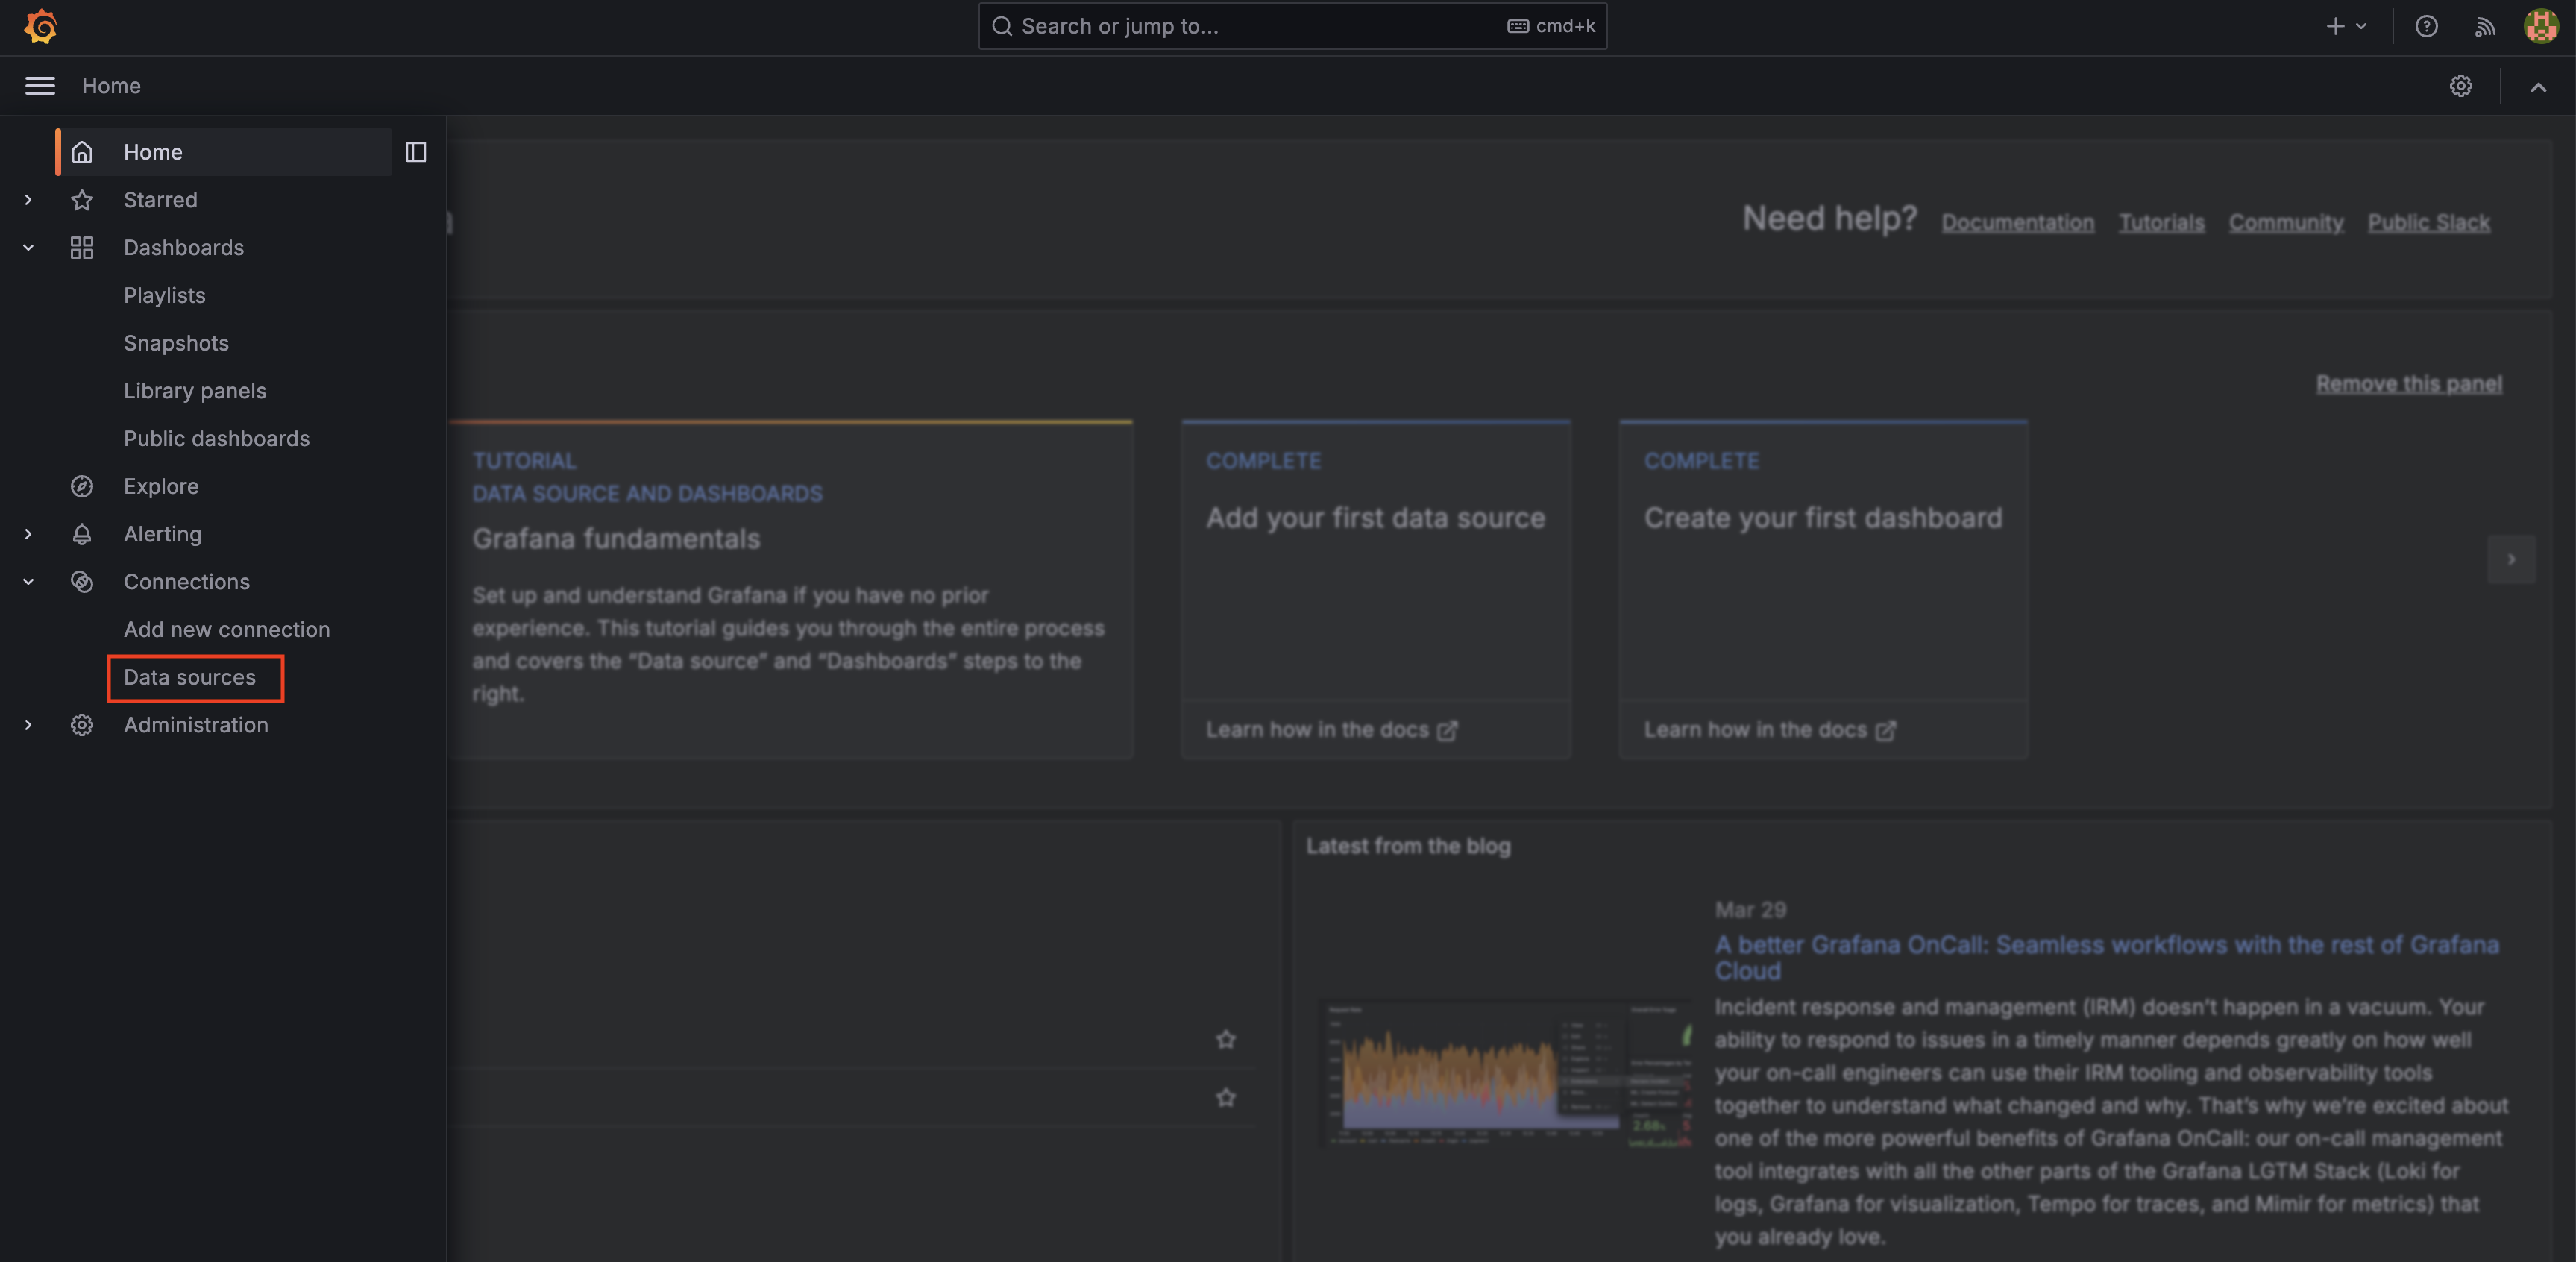
docker run -d -p 3000:3000 --name=grafana grafana/grafana-enterpriseYou can open the Grafana server at http://localhost:3000. The default credentials are admin as both username and password. Once logged into Grafana, click on the hamburger menu on the top left and go to Connections -> Data Sources.
Add Data Source
Click on Add new Data Source button present on the top right, and select Prometheus from the time series databases list. In the Prometheus server URL text box, put in the following URL: http://<host-ip-address>:9090. All the other configuration can be left as default. You can click on Save and Test button at the bottom, and confirm that the connection to Prometheus database is successful.
Add Dashboard
We are now all set to create the Grafana dashboard. For this, click on the + button on the top of the page to add a New Dashboard to Grafana. Save the dashboard with an appropriate name. Then, click on Add visualization, and select prometheus as the data source.
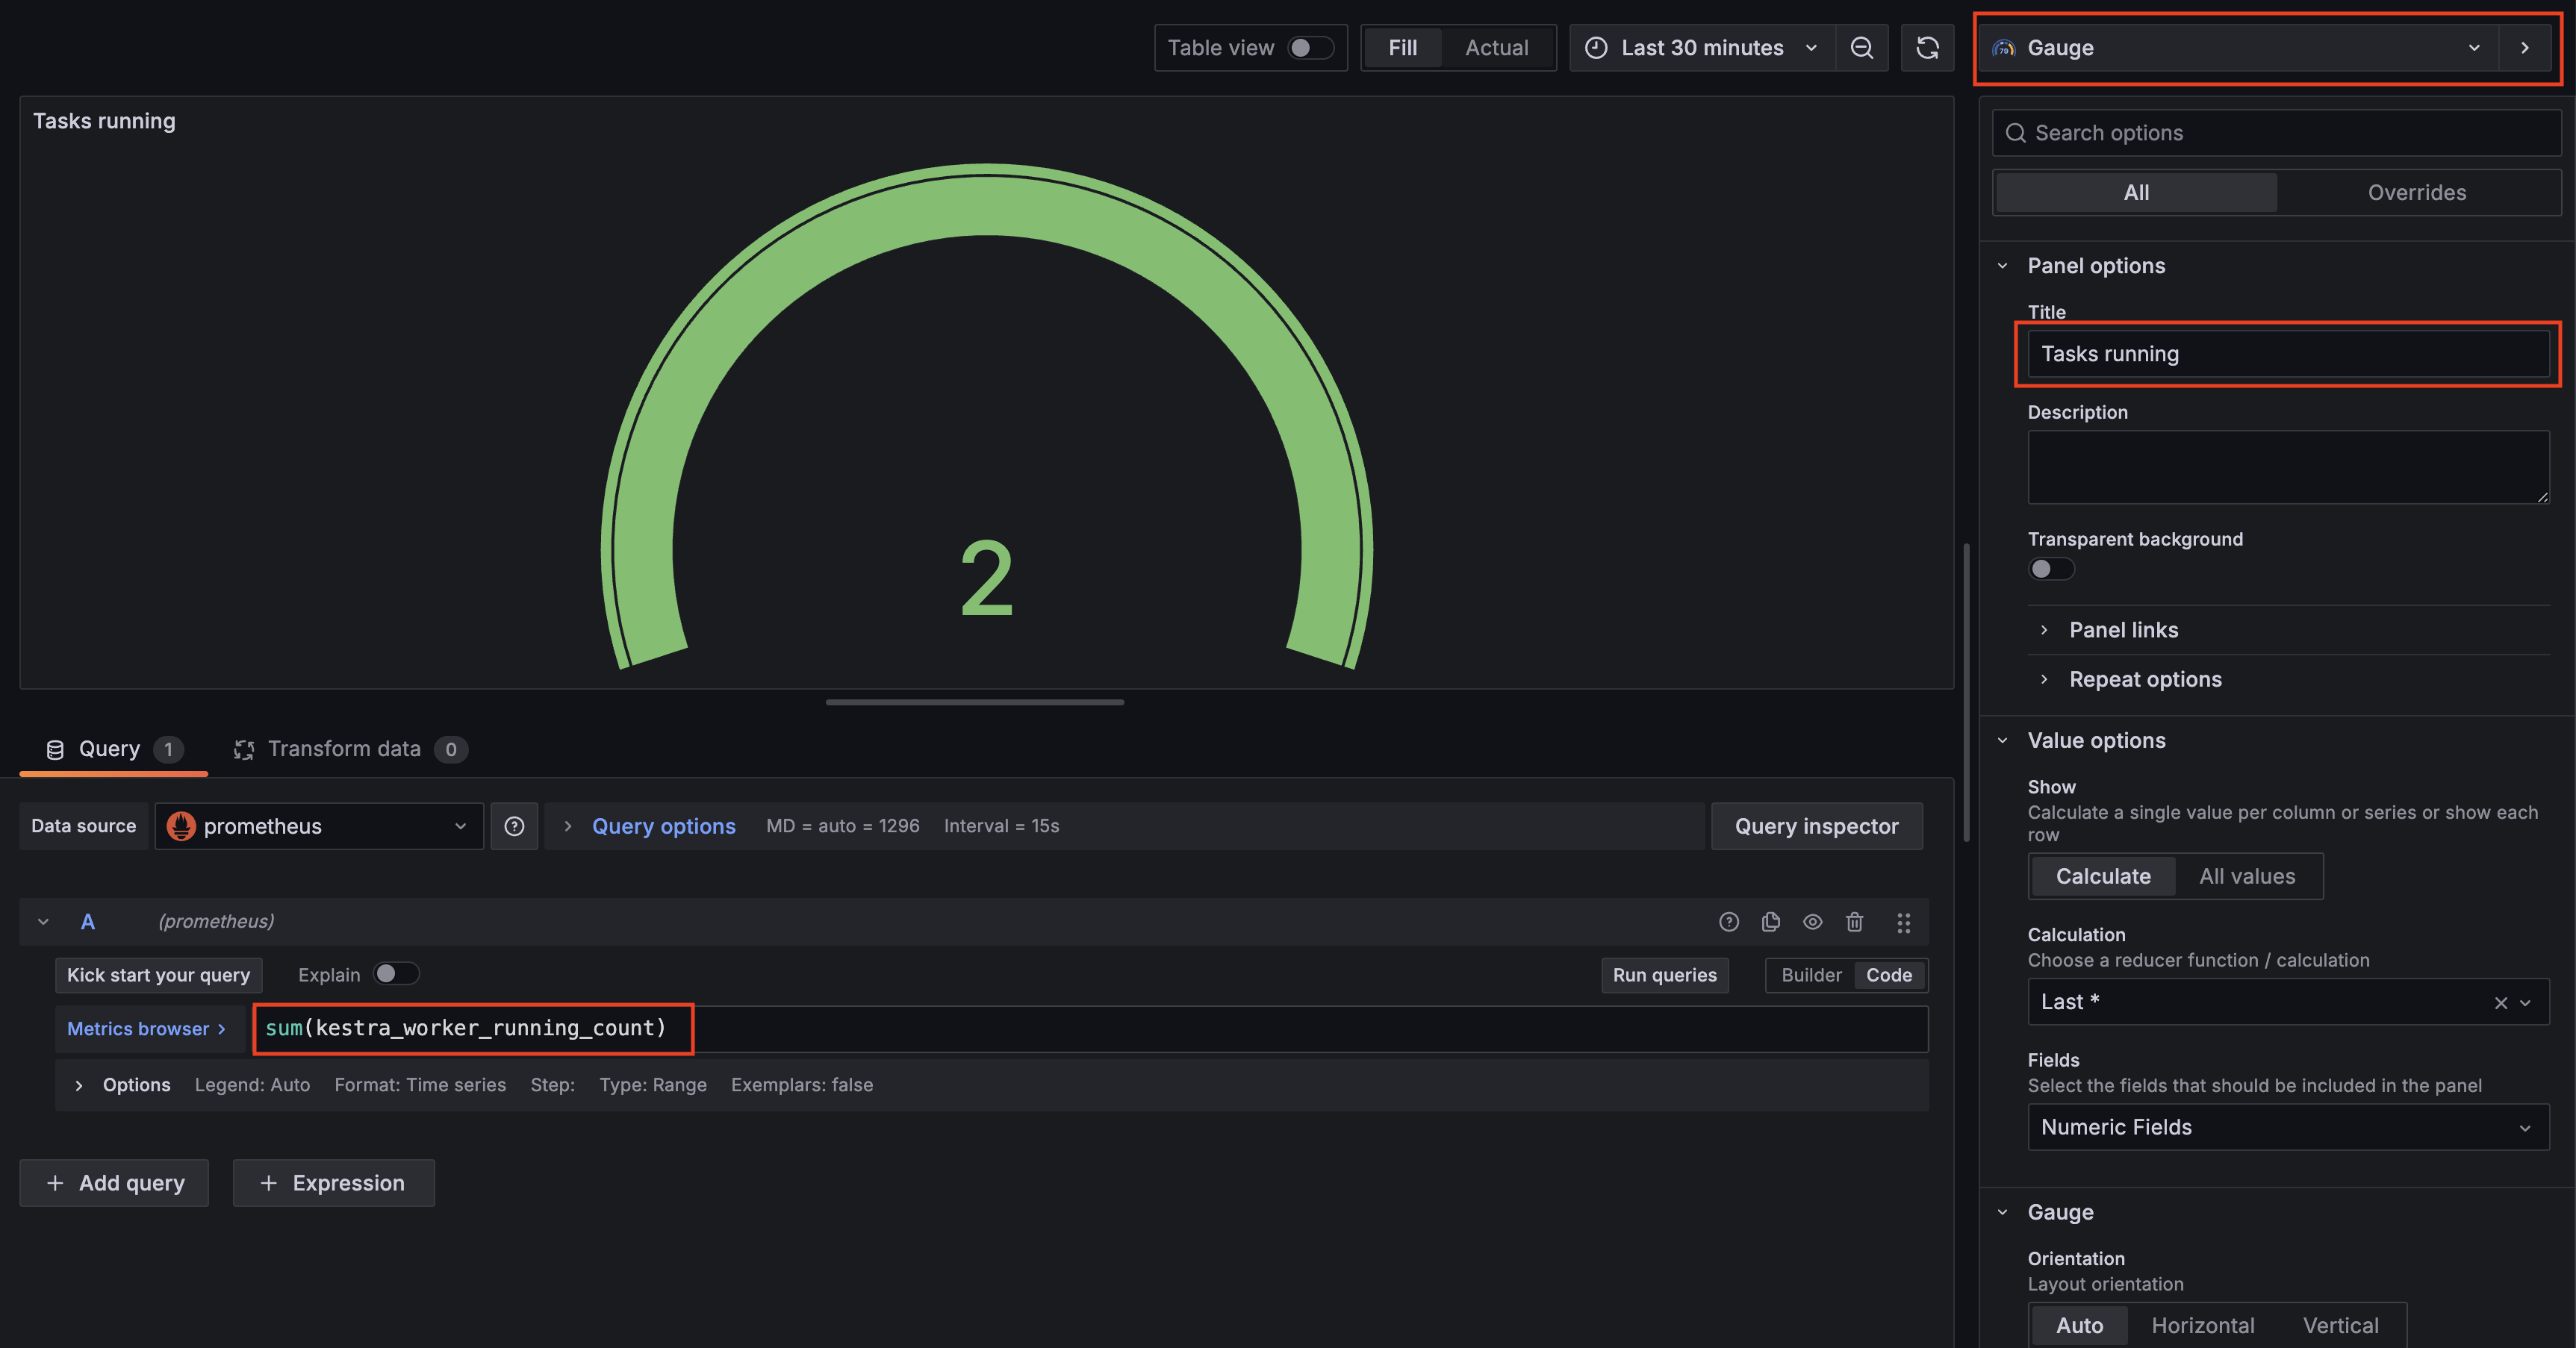
We will create a Gauge that shows the number of tasks that are presently running. For this, select Gauge as the Visualization in the top right corner. In the PromQL metrics explorer text box, you can write sum(kestra_worker_running_count). Click on Run queries button to ensure the Gauge shows up the number.
Head back to Kestra and create a number of tasks that will execute for a long time. The example below will sleep for 60 seconds:
id: sleepnamespace: company.team
tasks:  - id: sleep_task    type: io.kestra.plugin.scripts.shell.Commands    commands:      - sleep 60
Now we have some long-running tasks in progress, we can check that the Gauge correctly reflects the count. You can now put an appropriate title in the Panel options that says Tasks running.
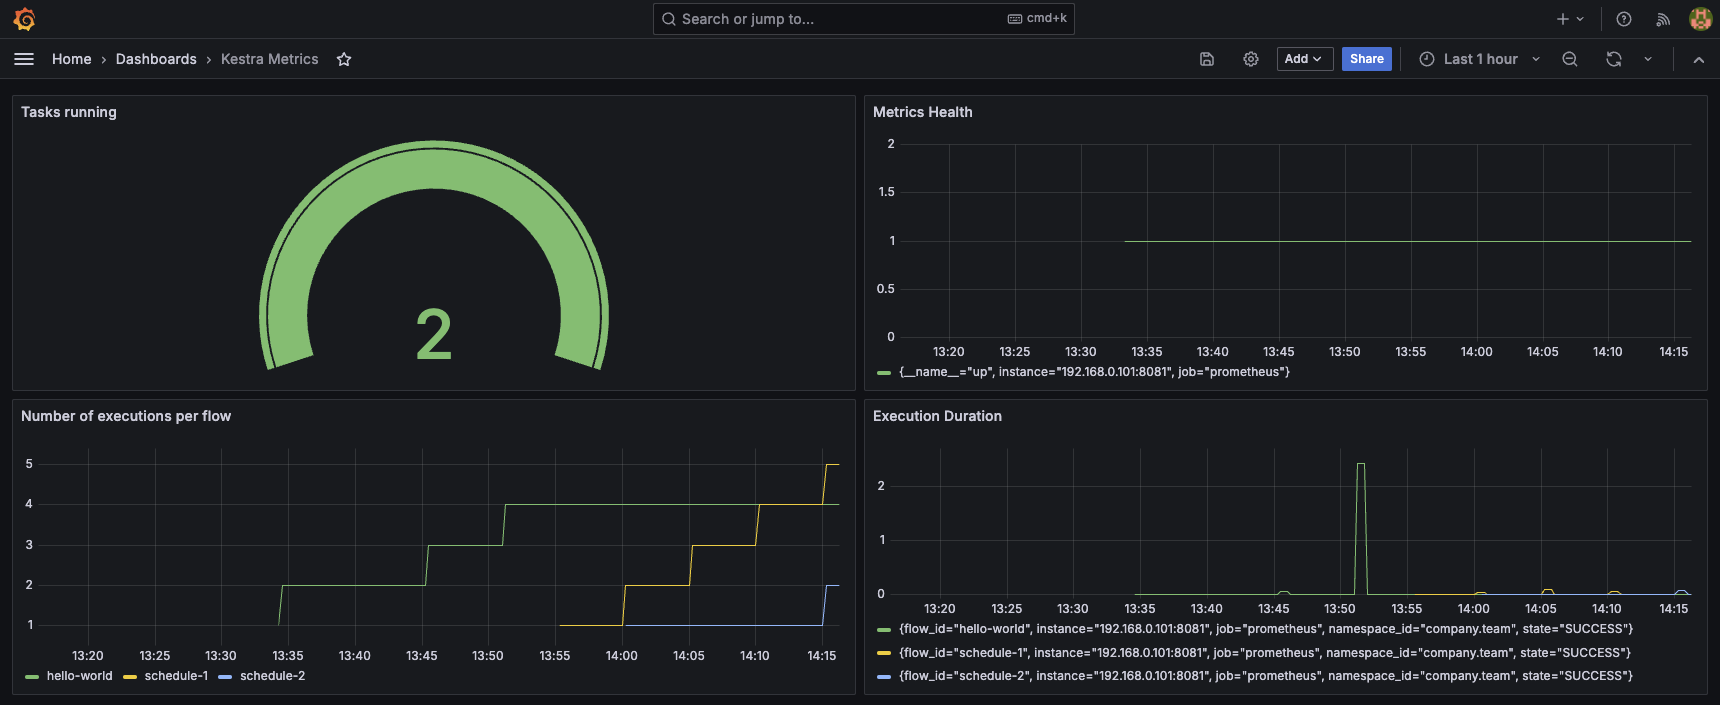
This is how your Grafana should look like:
Click on Save and Apply to add this gauge to the dashboard.
Similarly, you can now keep on adding more graphs to your dashboard. Here is one of the example dashboards for Kestra metrics.
The Alerting & Monitoring section includes an import-ready Grafana dashboard definition.
Was this page helpful?