 Instance Dashboard
Available on: >= 0.16.0
The Instance dashboard provides an overview of your instance’s health, including the status, configuration, and metrics of all worker, executor, scheduler, indexer, and webserver components.
Overview
The Instance feature in Kestra Enterprise Edition provides centralized control over your platform’s infrastructure. Using this dashboard, you can centrally monitor your instance’s health and quickly identify any issues that need attention without having to rely on any additional observability tools.
It allows administrators to monitor service health, manage configurations, and communicate announcements (like planned maintenance downtime) to users. Below is a breakdown of its key functionalities.
Instance overview
The Overview tab gives a high-level snapshot of your instance’s operational status. Here, you can:
- View active services (e.g., Scheduler, Executor, Worker).
- Check real-time metrics like uptime and service liveness.
- Access detailed configurations for each service (e.g., version, hostname, heartbeat intervals).
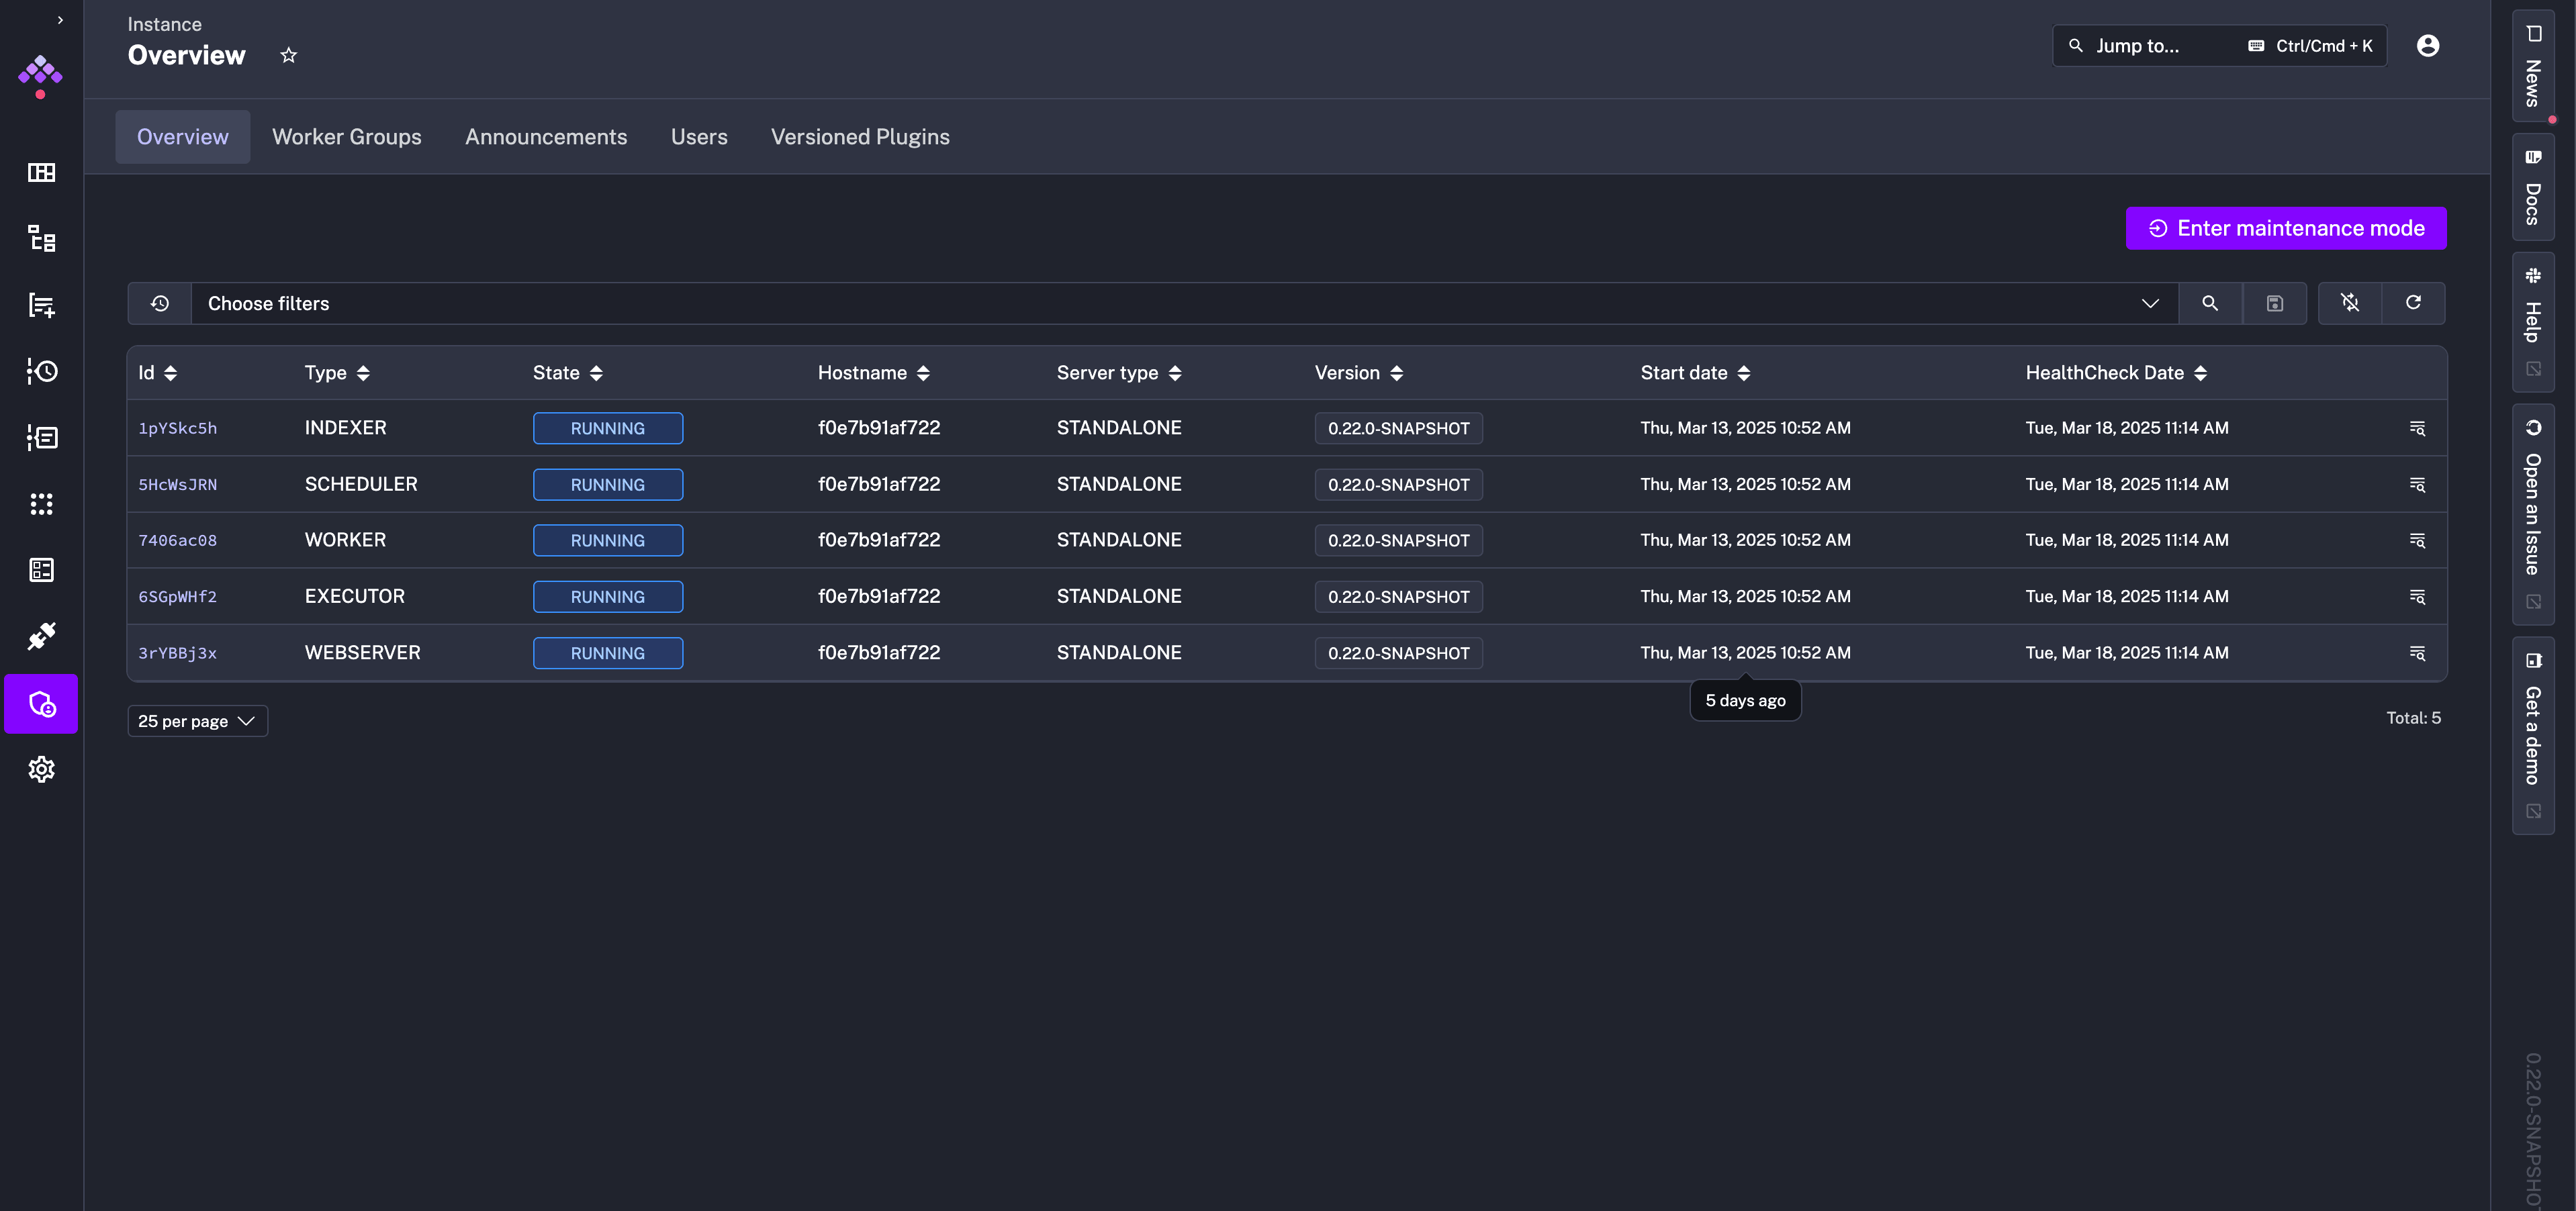
Monitoring services
Kestra tracks the health of critical components, including:
- Workers: Execute tasks.
- Schedulers: Trigger workflows.
- Executors: Manage task execution.
- Webservers: Host the UI and API.
Each service displays:
- State: Whether the service is active (
RUNNING) or unresponsive. - Host Name: Identifier of the server/pod (e.g.,
kafka-ee-preview-79fb7755f8-zhlhq). - Server Type: For example, STANDALONE.
- Version
- Start Date
- Health Check Date
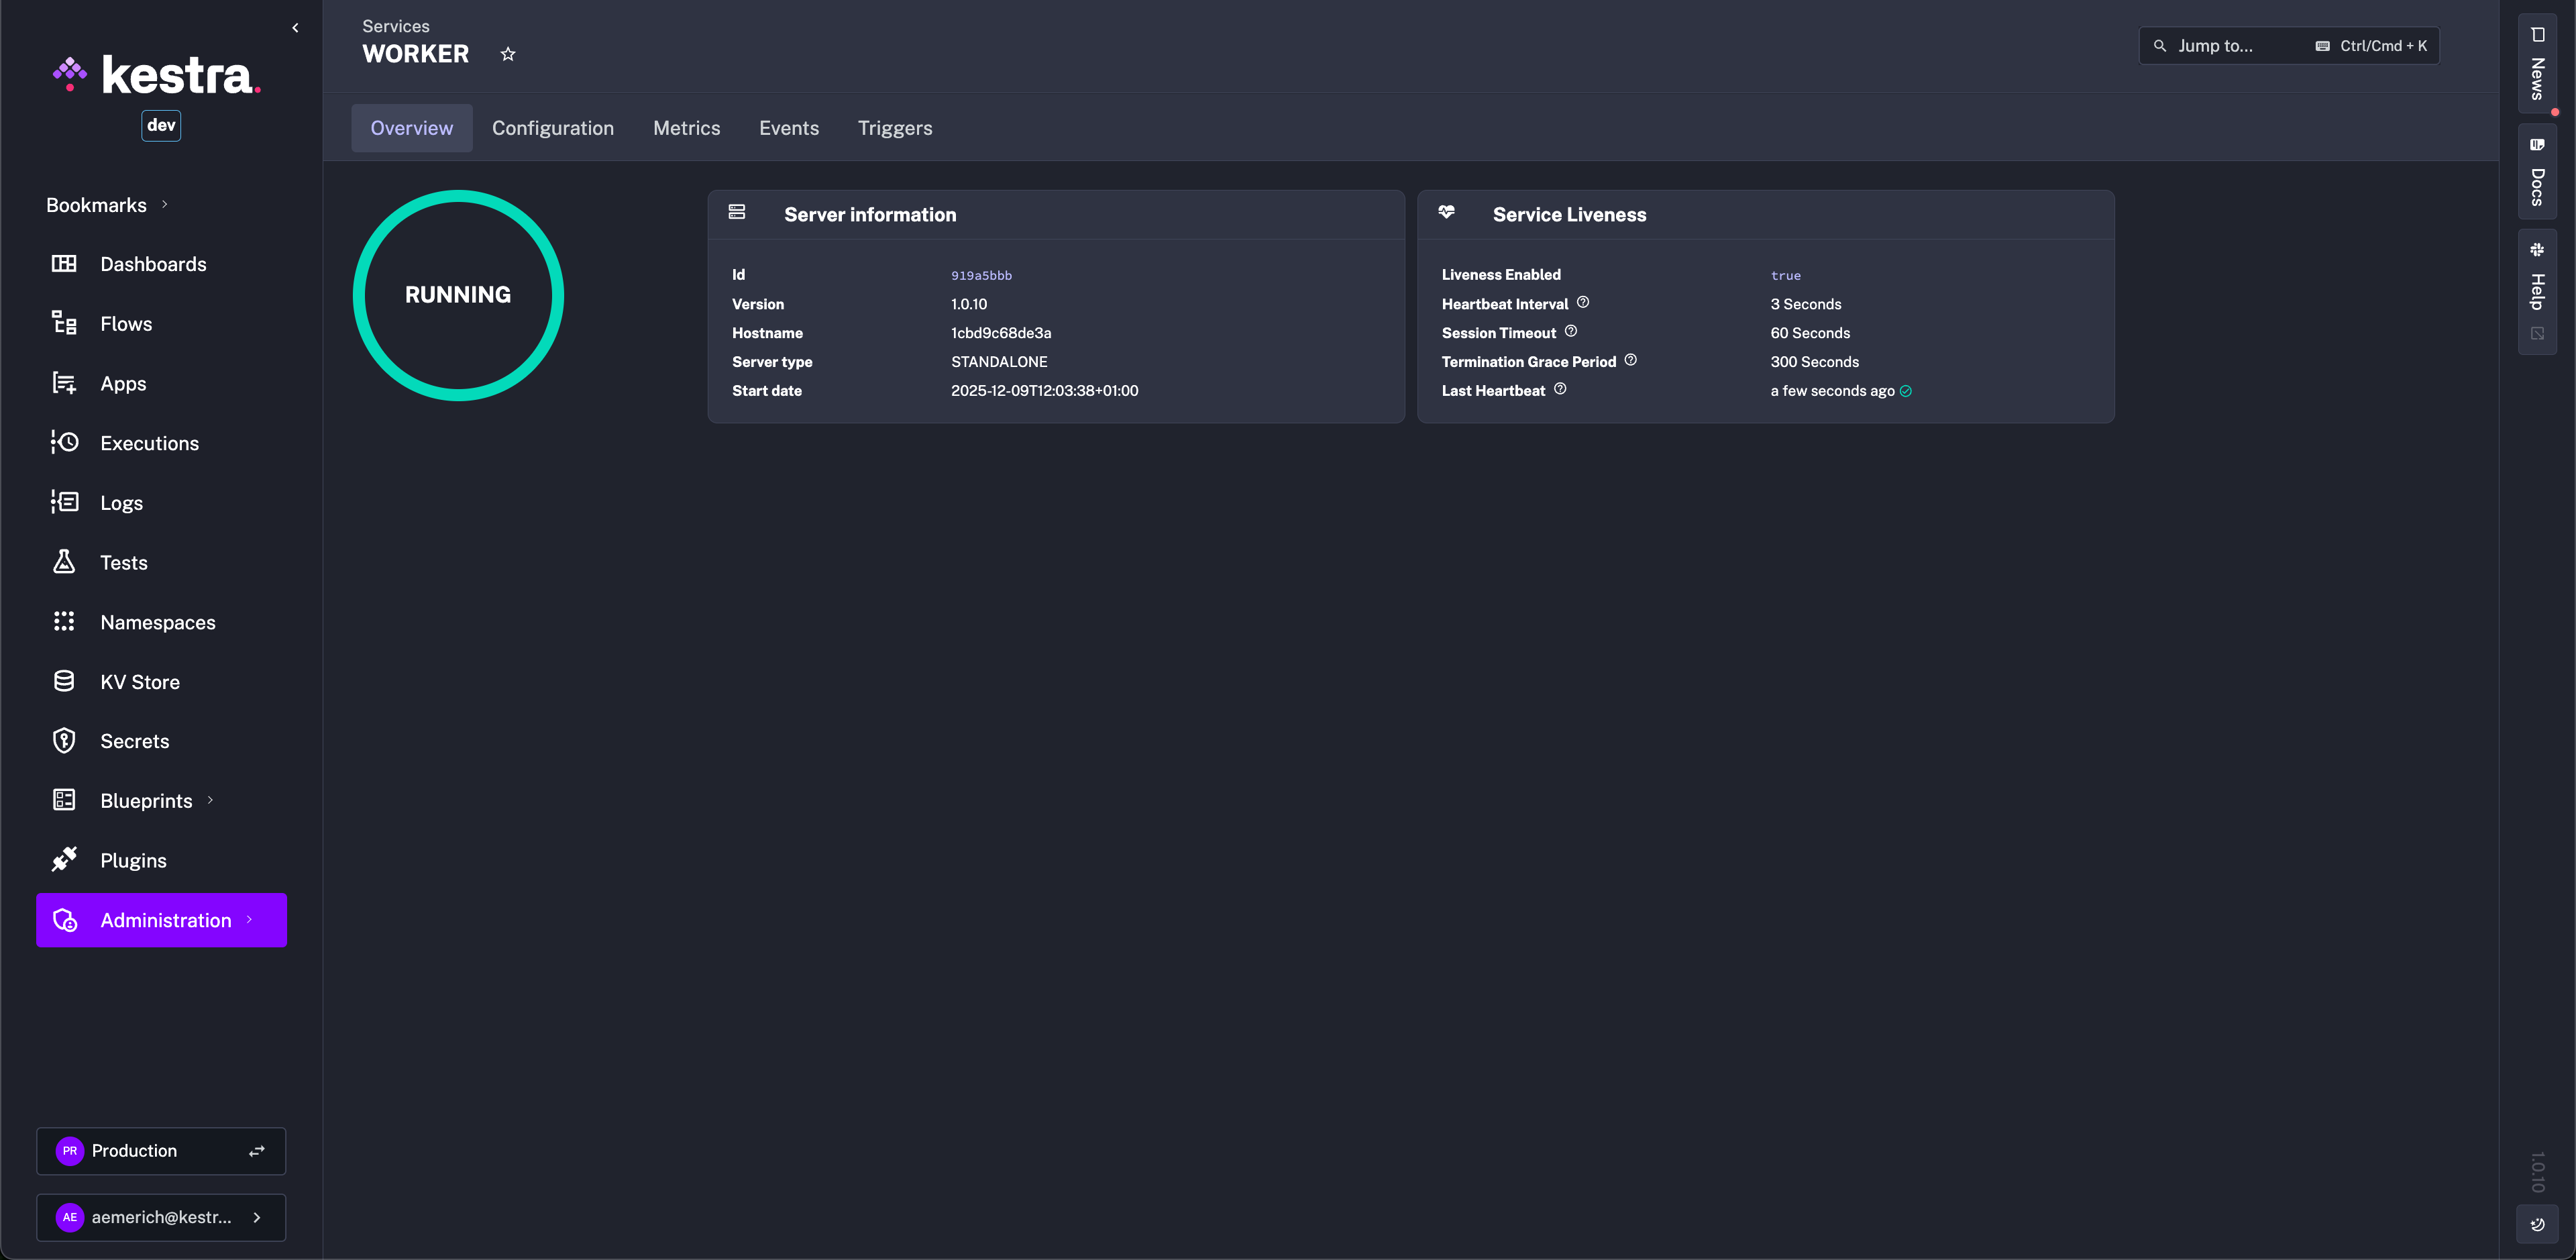
Server information and liveness
Each service instance provides technical details for debugging when clicked on:
- Hostname: Identifier of the server/pod (e.g.,
kafka-ee-preview-79fb7755f8-zhlhq). - Session Timeout: Time before an unresponsive service is marked offline (e.g.,
60 seconds). - Heartbeat Interval: The expected time between heartbeats.
- Last Heartbeat: Timestamp of the latest health check.
- Termination Grace Period: The expected time for this service to complete all its tasks before initiating a graceful shutdown.
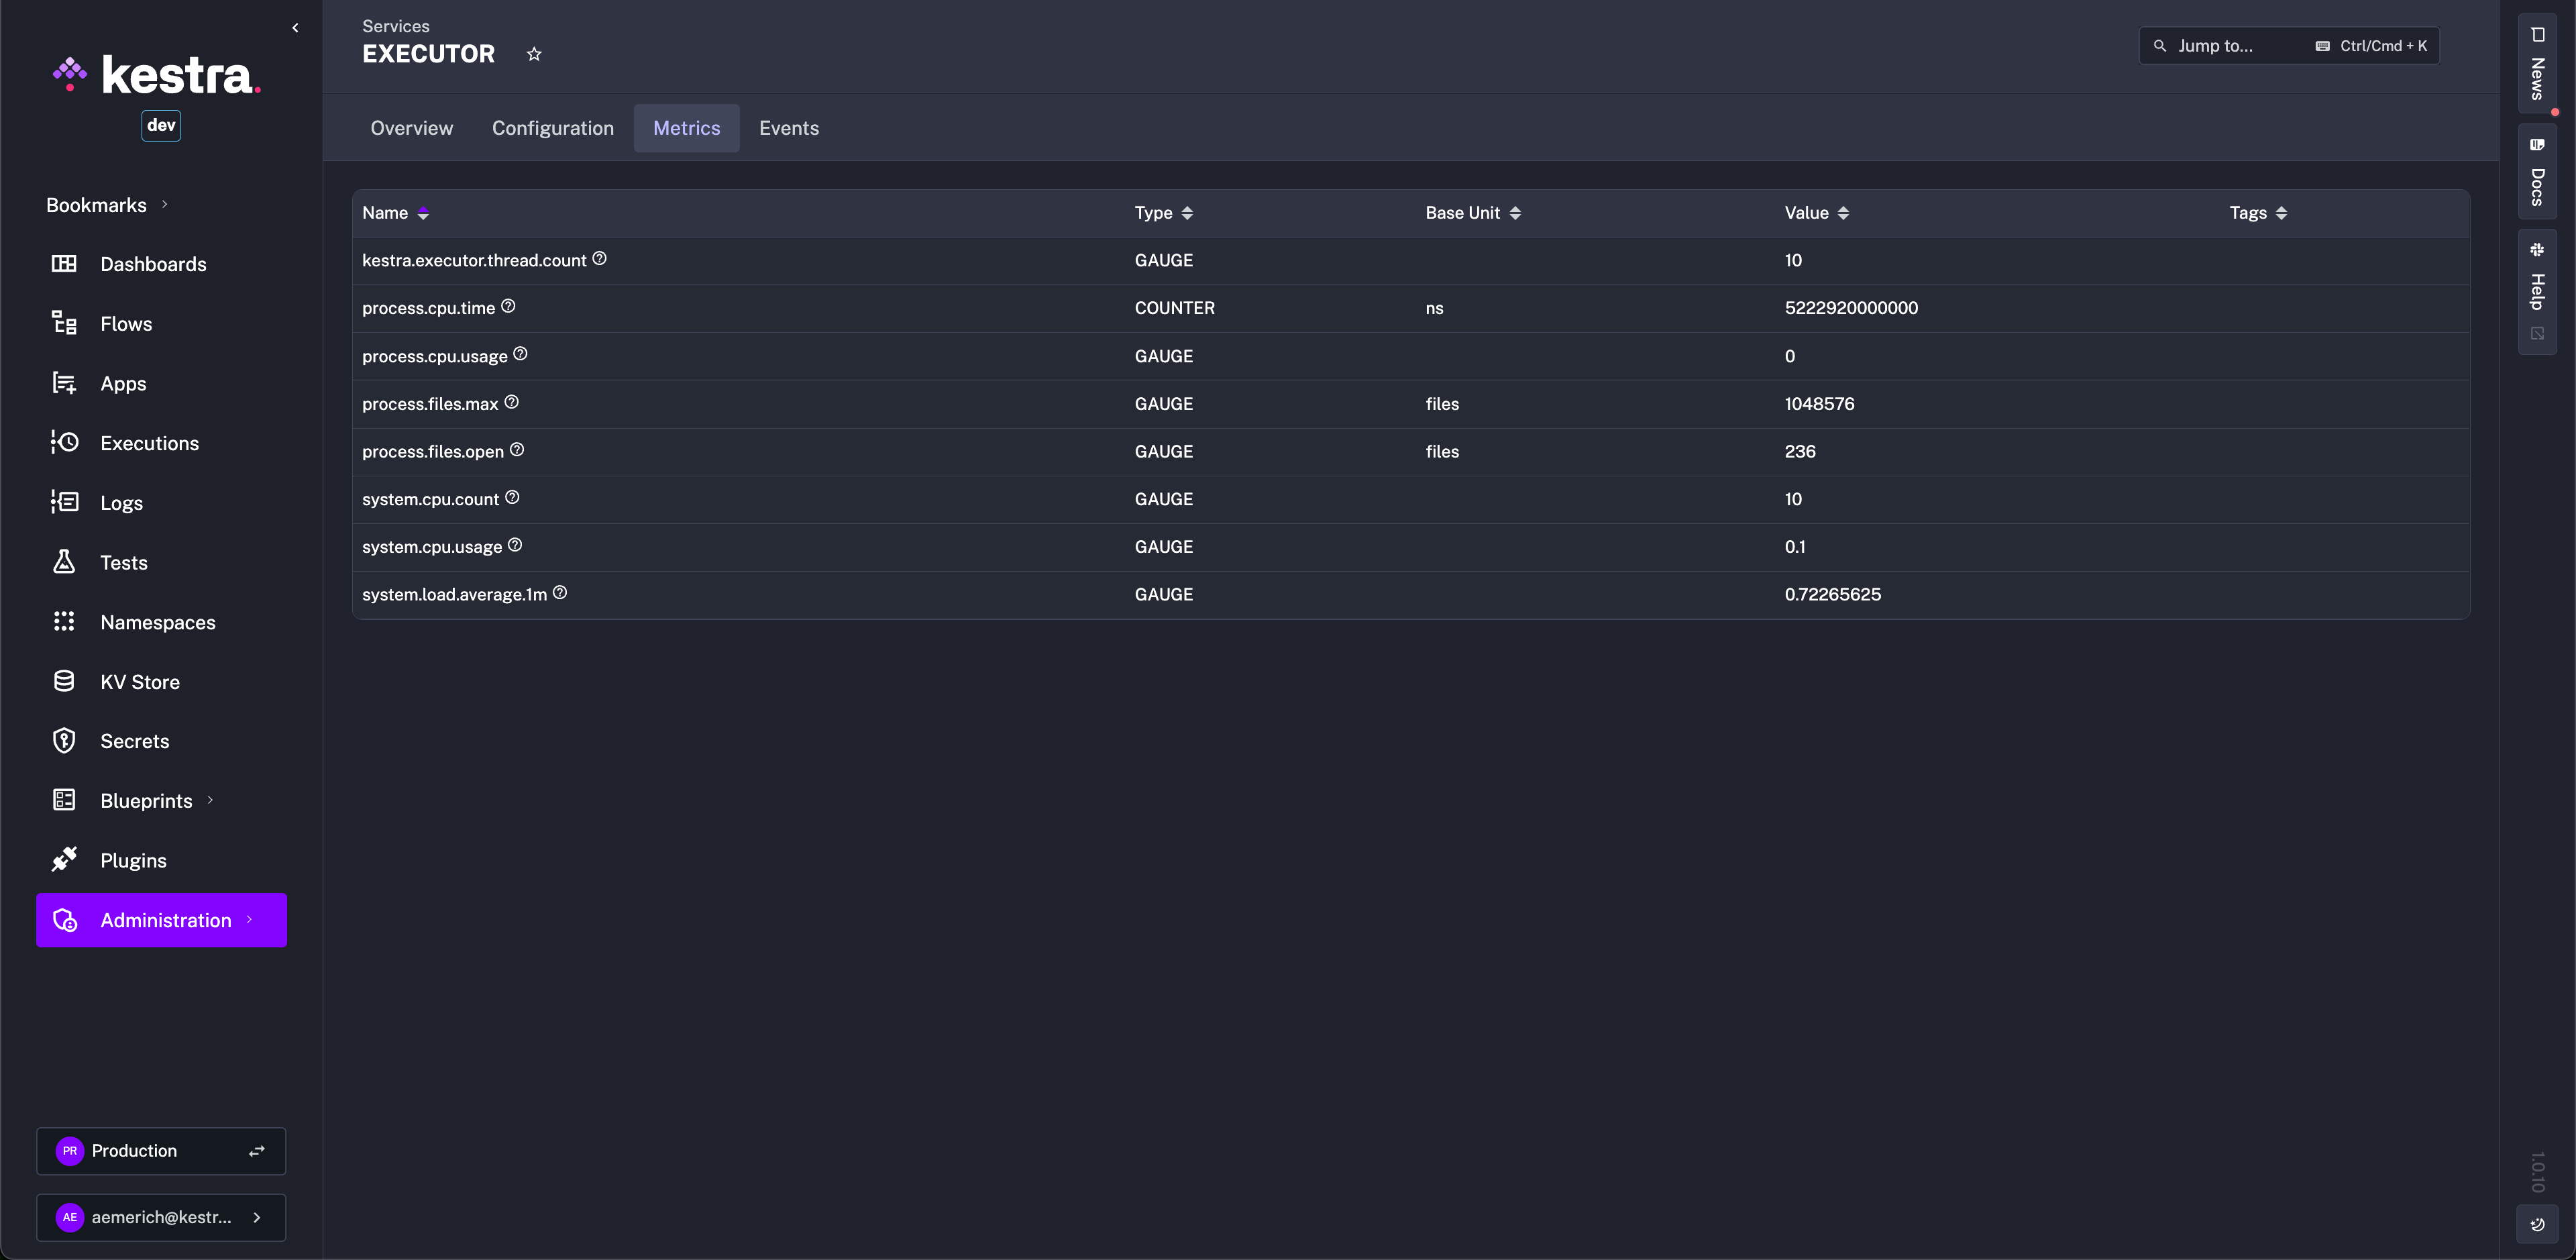
Additional tabs include Configuration to display port configuration, Metrics such as CPU Usage and Executor Thread Count:
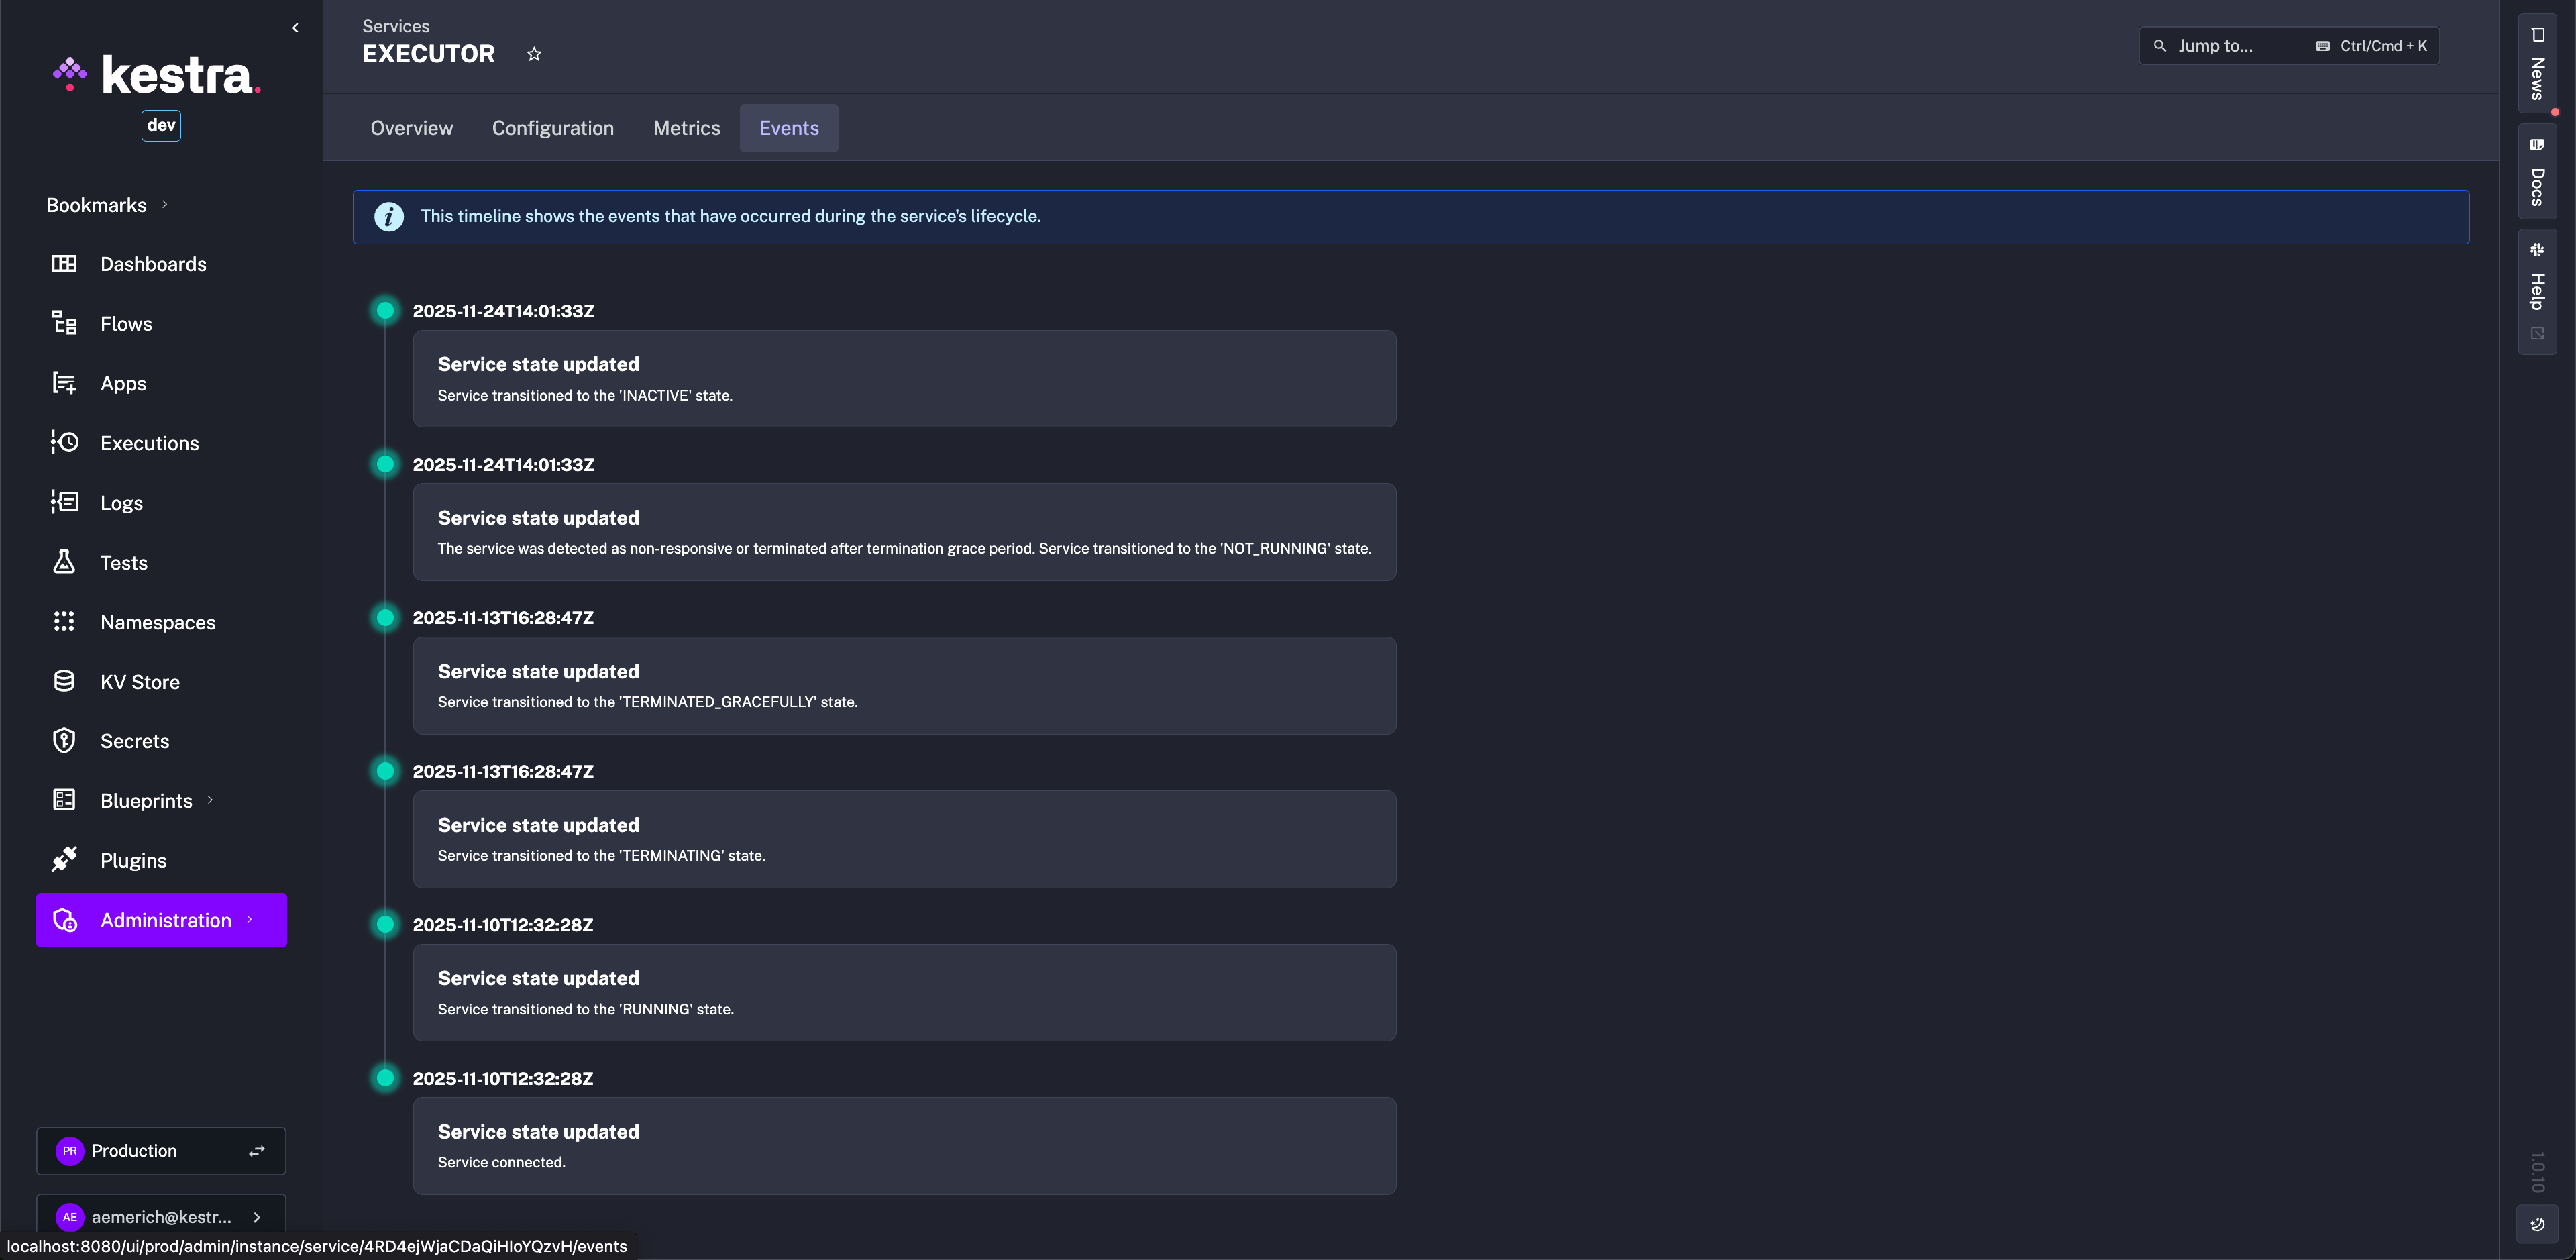
And an Events Timeline to give an overview of the service's lifecycle:
Announcements
Notify users about planned maintenance or updates:
- Create Announcements: Specify a title, message, and date range.
- Choose Type: Define severity of the announcement (e.g.,
info,warning,error).
Announcements appear in the UI during the selected period, ensuring users stay informed.
Maintenance mode
Temporarily pause all workflows and services for upgrades:
- Enable Maintenance Mode from the Instance page.
- Services enter a paused state, and new executions are blocked.
- Combine it with the Announcements feature so users see a maintenance banner while running workflows gracefully terminate.
Worker Groups
Create worker groups to isolate workloads or delegate tasks to specific workers:
- Add Worker Groups: Define groups with specific resource limits or labels.
- Assign Tasks: Route workflows to designated groups via worker group key within a task or trigger.
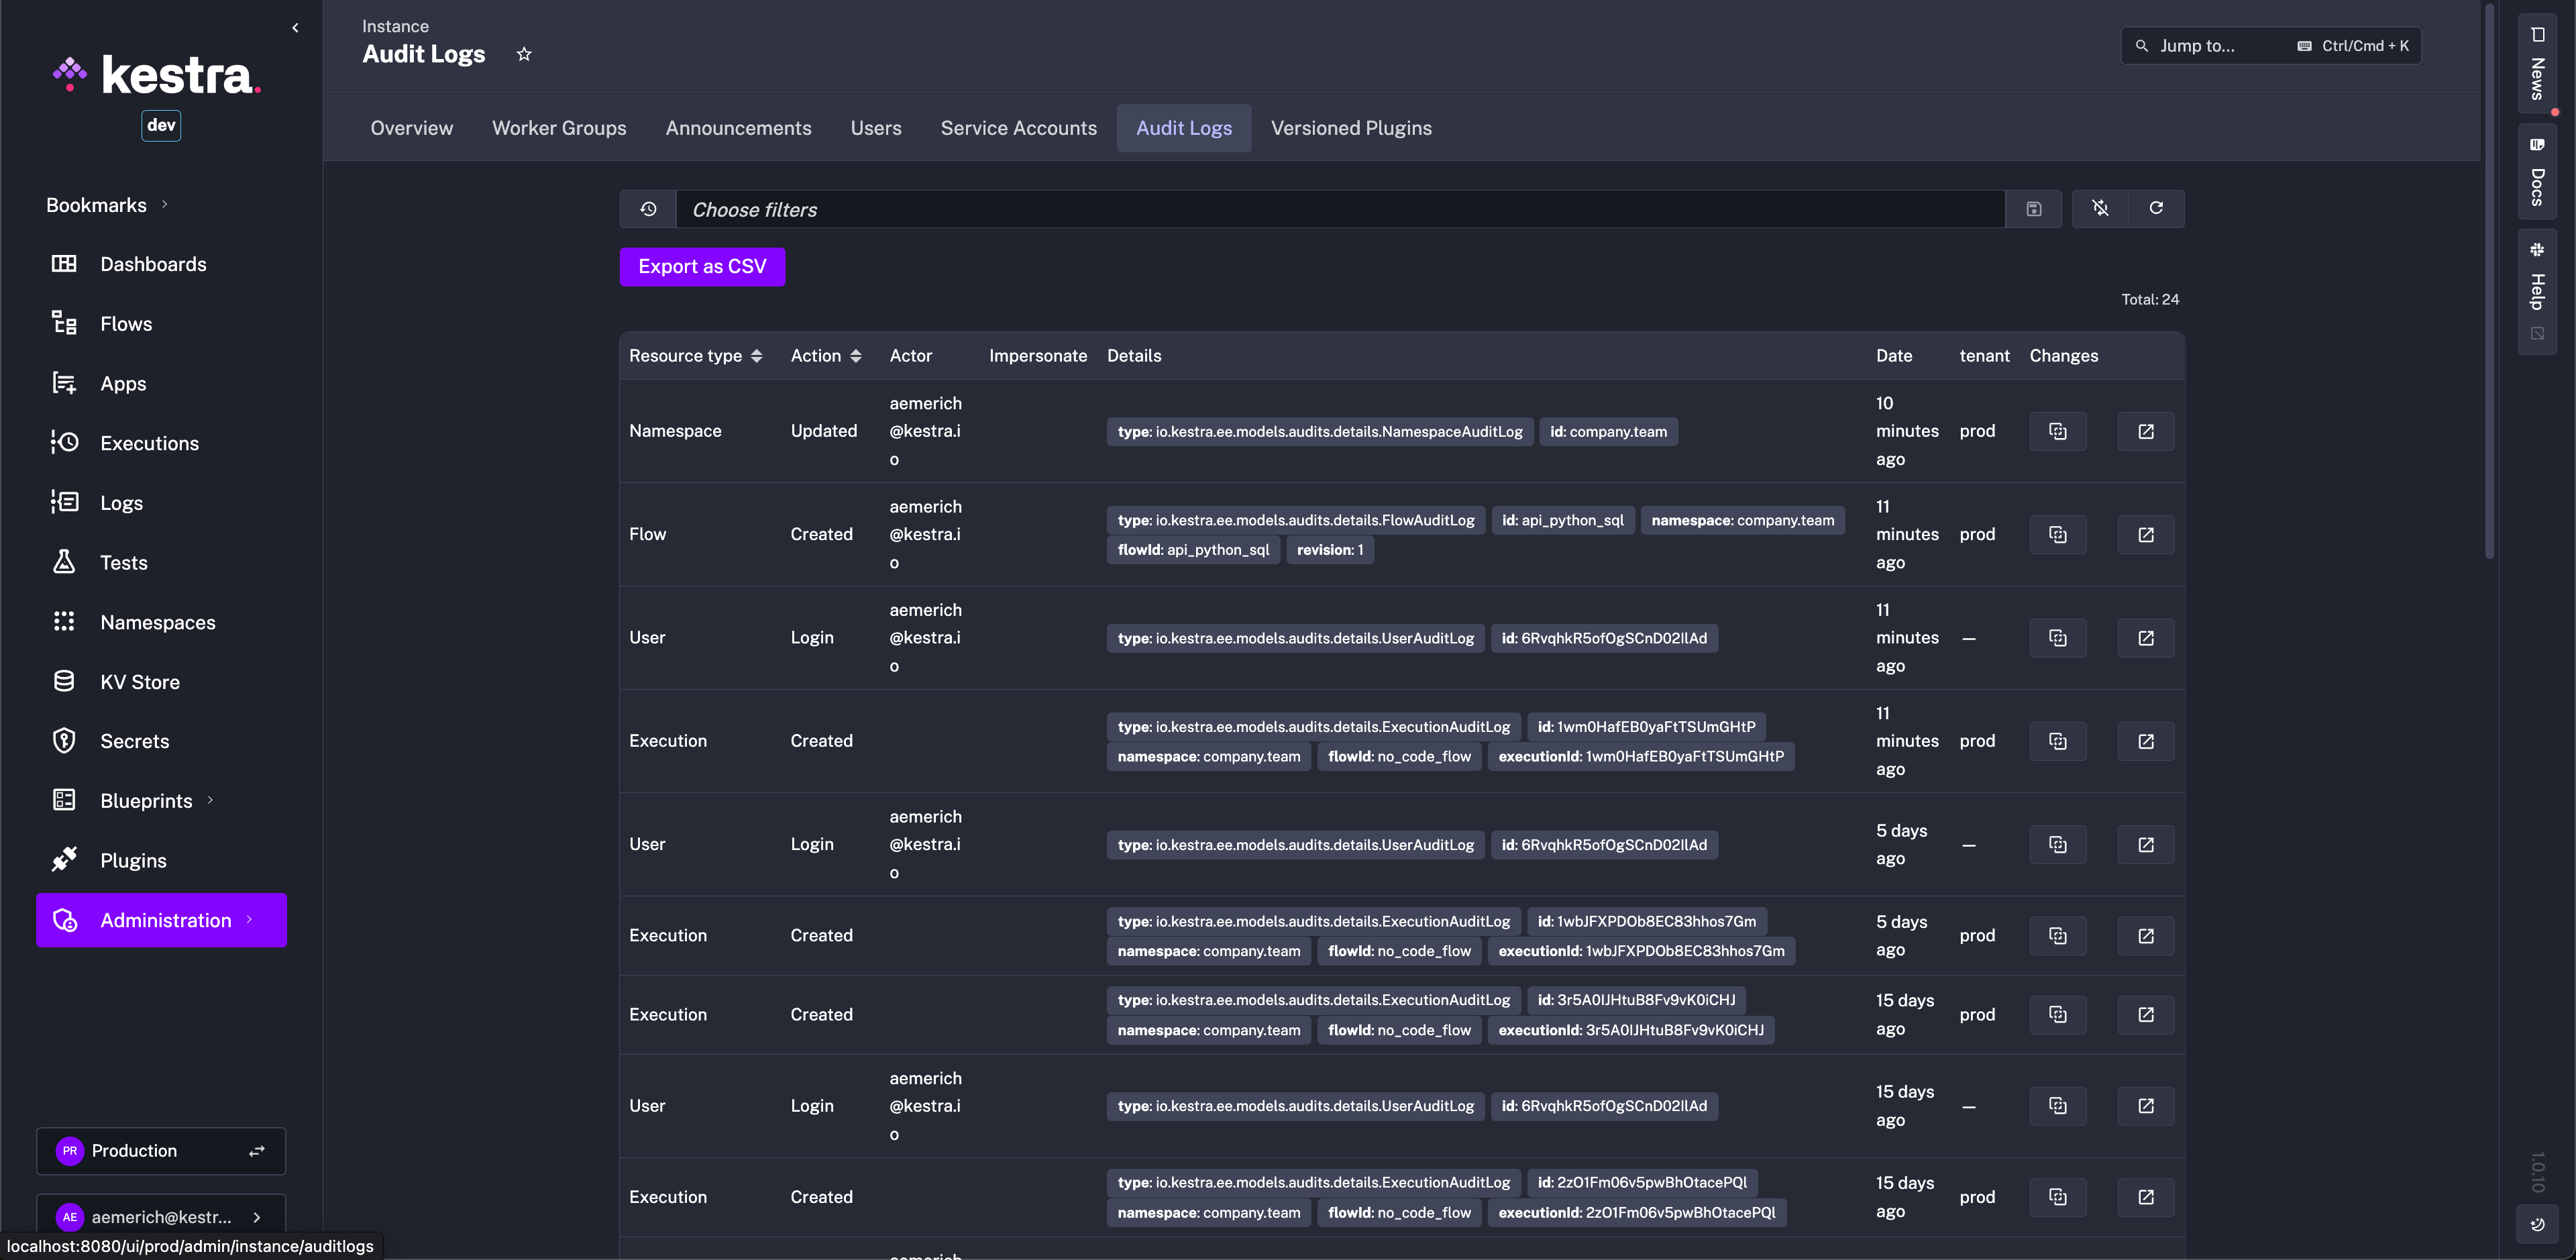
Audit logs
View Audit Logs at a glance to monitor actions on all resource types taken by users in the instance.
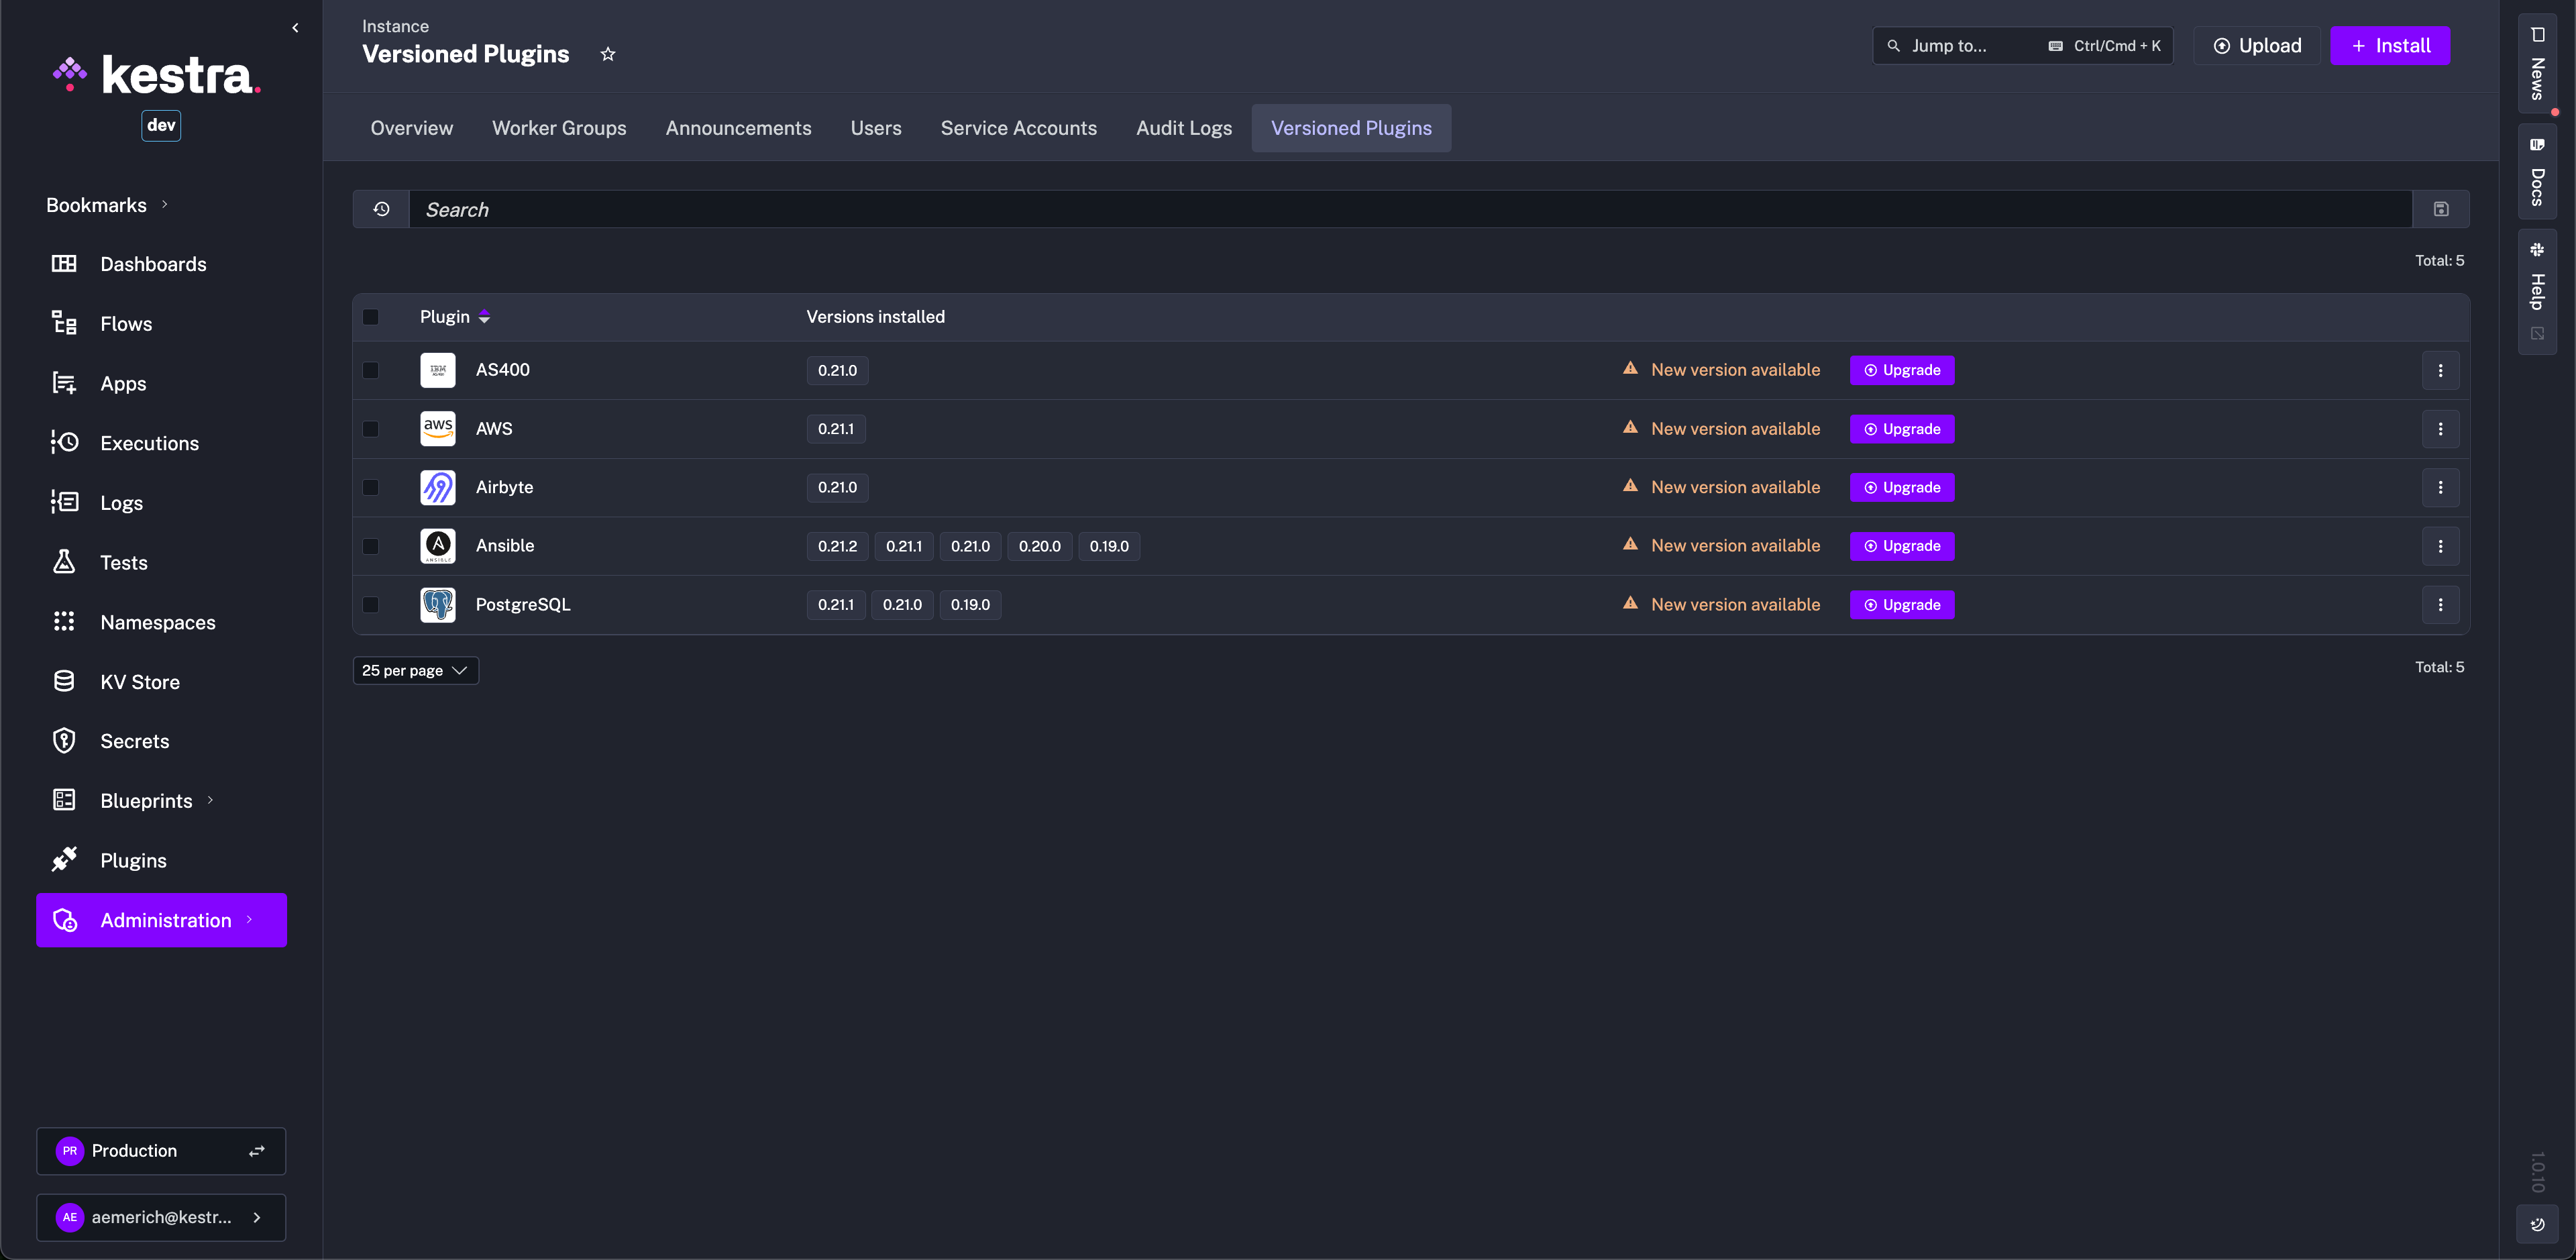
Versioned plugins
View all installed versioned plugins on the instance and upgrade, install, or uninstall as needed.
Was this page helpful?