Authors
Benoit Pimpaud
Benoit Pimpaud
Kestra 0.21 introduces no-code forms for simpler workflow creation, customizable dashboards for more flexible monitoring, a new core property for cleanup tasks, advanced log forwarding across your entire infrastructure, and several other improvements.
The table below highlights the key features of this release.
| Feature | Description | Edition |
|---|---|---|
| Log Shipper | Forward Kestra logs across your entire infrastructure | Enterprise Edition |
New finally core property | Run cleanup tasks at the end of your workflow even if previous tasks fail | All Editions |
| No Code | New experience regarding no-code flow creation and task edition | All Editions |
| Custom Dashboards | Create your own custom dashboards, tailored to your monitoring needs | All Editions |
| Maintenance Mode | Set your Kestra instance in maintenance mode to streamline server upgrades | Enterprise Edition |
Check the video below for a quick overview of the new features.
Let’s dive into these highlights and other enhancements in more detail.
The new Log Shipper feature streamlines how you manage and distribute logs across your entire infrastructure. This synchronization automatically batches logs into optimized chunks and manages offset keys. It provides reliable, consistent log delivery without overloading your systems or losing critical data.
Built on plugin architecture, the Log Shipper can forward logs to Elasticsearch, Datadog, New Relic, Azure Monitor, Google Operational Suite, AWS CloudWatch, and OpenTelemetry.
The examples below show how to configure Log Shipper with Datadog and AWS CloudWatch.
id: log_shippernamespace: company.team
tasks:  - id: log_export    type: io.kestra.plugin.ee.core.log.LogShipper    logLevelFilter: INFO    batchSize: 1000    lookbackPeriod: P1D    logExporters:      - id: data_dog        type: io.kestra.plugin.ee.datadog.LogExporter        basePath: '{{ secret("DATADOG_INSTANCE_URL") }}'        apiKey: '{{ secret("DATADOG_API_KEY") }}'
triggers:  - id: daily    type: io.kestra.plugin.core.trigger.Schedule    cron: "@daily"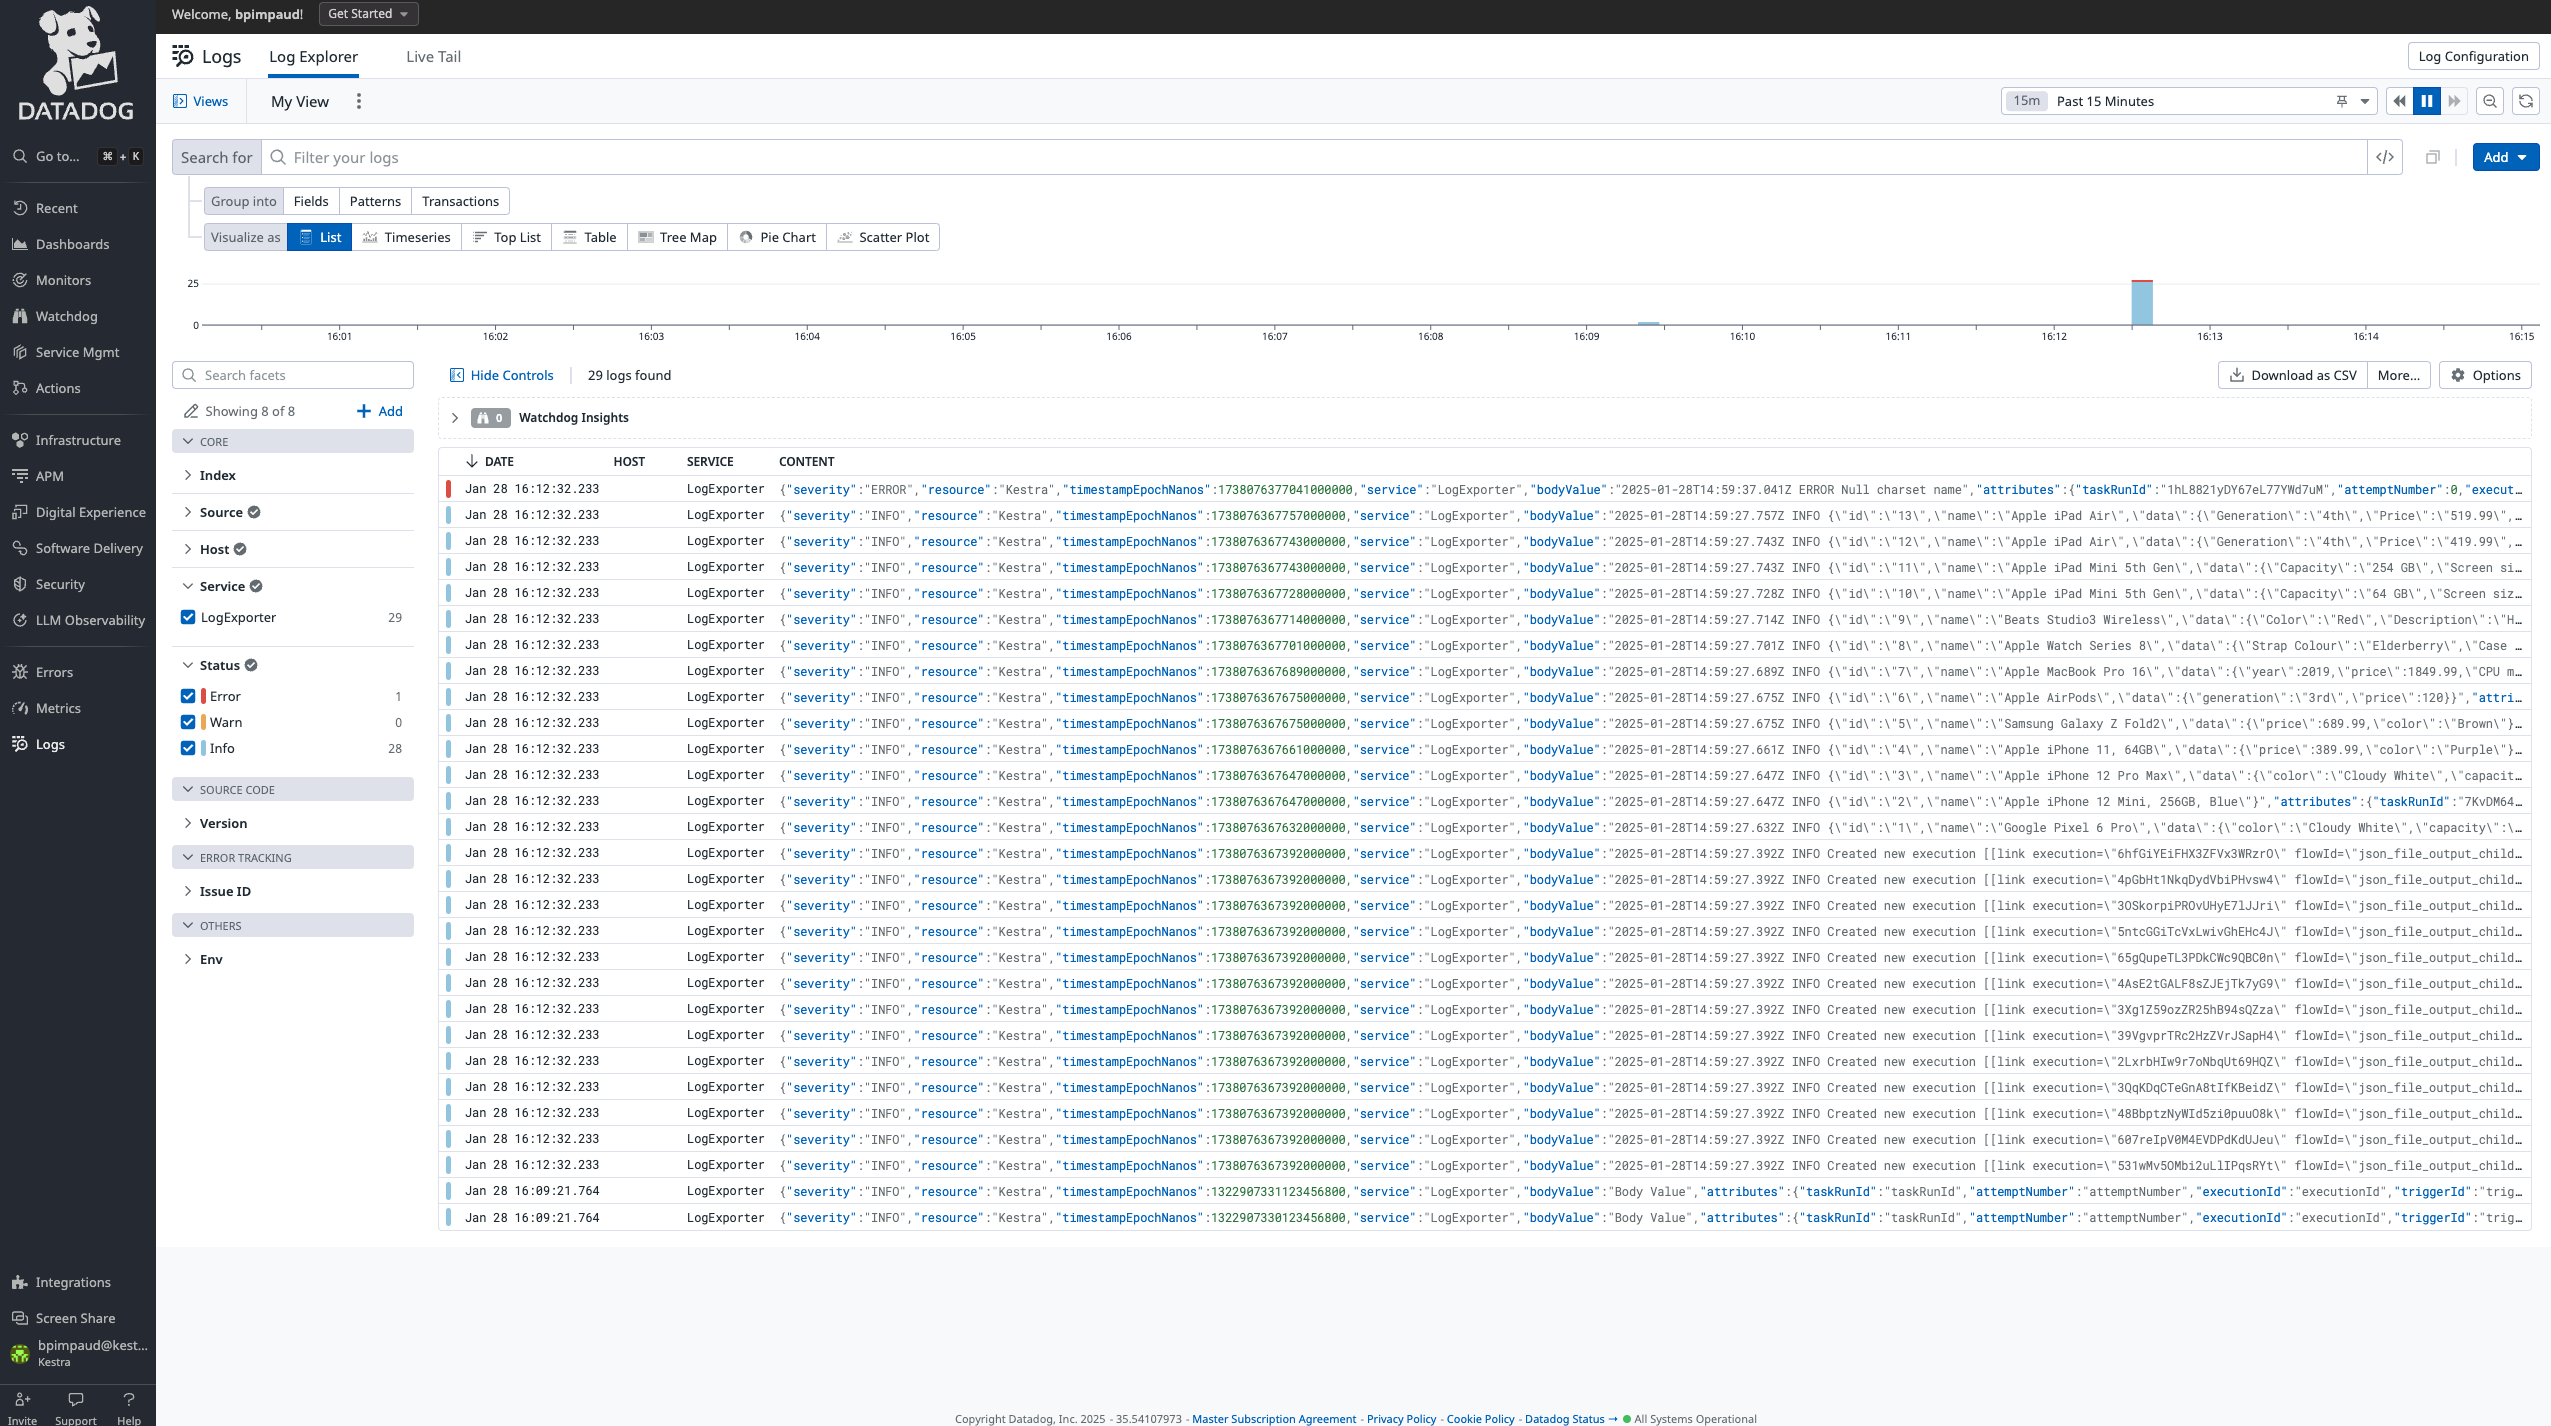
id: log_shippernamespace: company.team
tasks:  - id: log_export    type: io.kestra.plugin.ee.core.log.LogShipper    logLevelFilter: INFO    batchSize: 1000    lookbackPeriod: P1D    logExporters:      - id: aws_cloudwatch        type: io.kestra.plugin.ee.aws.LogExporter        accessKeyId: "{{ secret('AWS_ACCESS_KEY_ID') }}"        secretKeyId: "{{ secret('AWS_SECRET_ACCESS_KEY') }}"        region: us-east-1
triggers:  - id: daily    type: io.kestra.plugin.core.trigger.Schedule    cron: "0 9 * * *" # everyday at 9am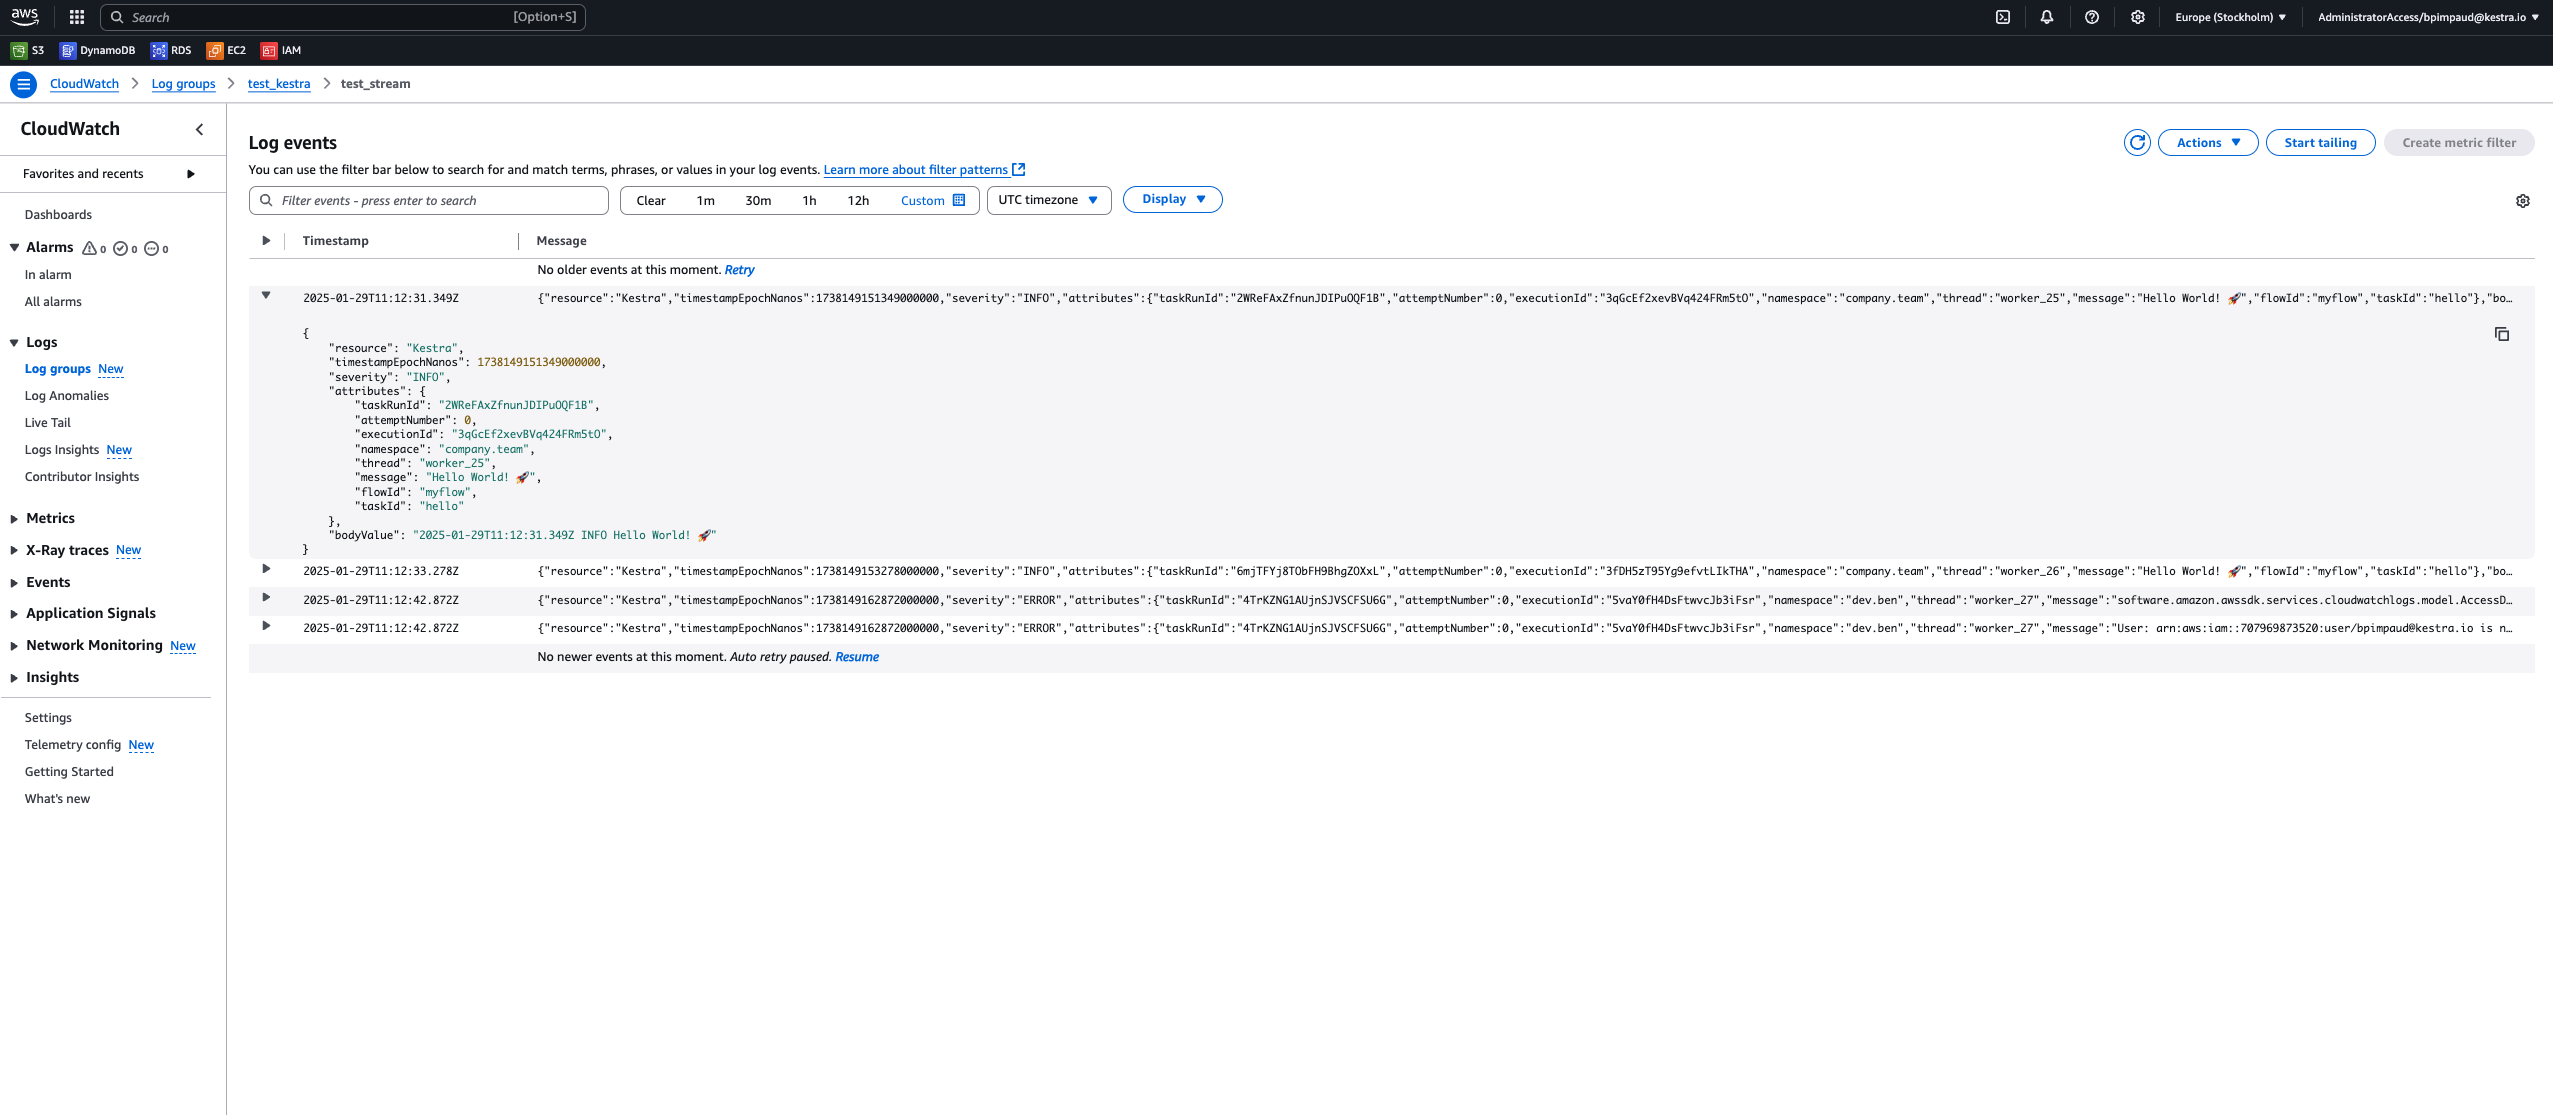
Kestra’s interface has always bridged the gap between code and no-code. In this release, we’ve redesigned our no-code flow editor. The new interface provides intuitive left-side panels for flow properties and organized drawers for simpler navigation of complex plugin properties. A breadcrumb shows your position within each configuration.
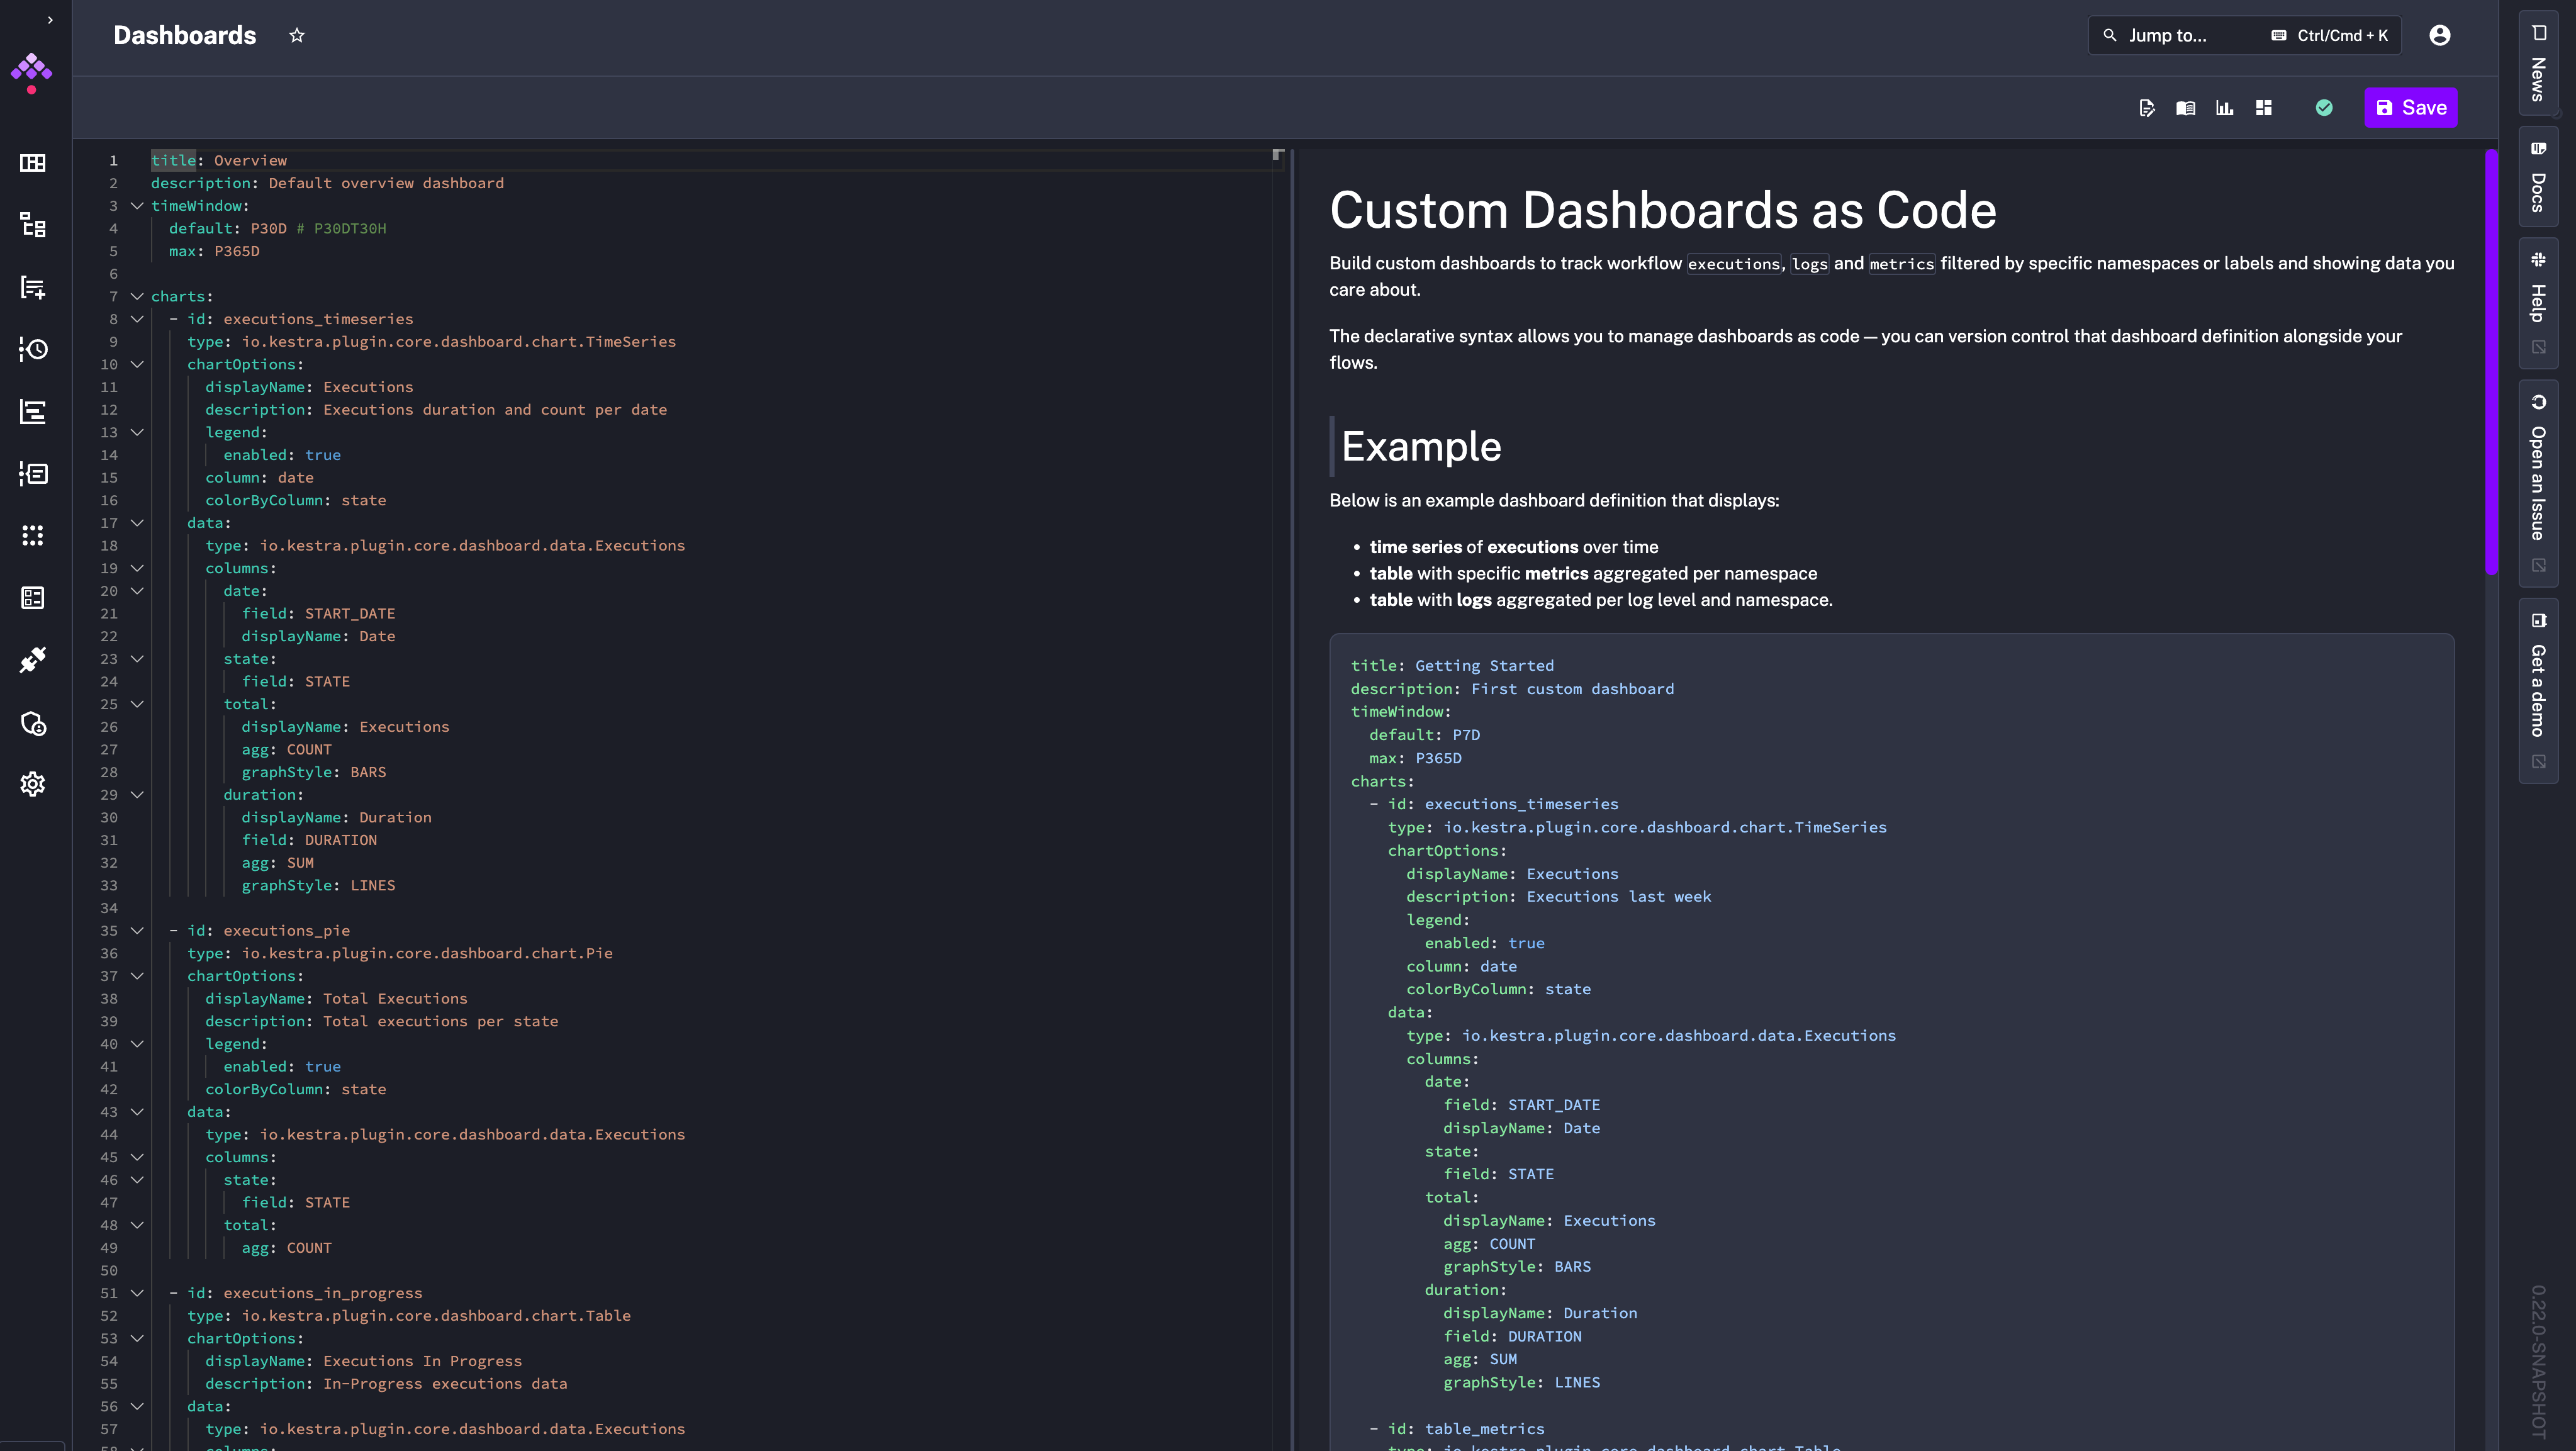
Monitoring workflow execution states is a critical aspect of orchestration. This release adds the ability to create custom dashboards, so you can track the executions, logs and metrics in a way that matches your needs. You can declare these dashboards as code in the UI’s editor, defining both chart types and data sources.
As with everything in Kestra, you can manage dashboards as code (and you can create them via Terraform or API). Clicking + Create new dashboard opens a code editor where you can define the dashboard layout and data sources.
Here’s an example that displays executions over time and a pie chart of execution states:
title: Data Team Executionsdescription: Data Executions dashboardtimeWindow:  default: P30D # P30DT30H  max: P365D
charts:  - id: executions_timeseries    type: io.kestra.plugin.core.dashboard.chart.TimeSeries    chartOptions:      displayName: Executions      description: Executions duration and count per date      legend:        enabled: true      column: date      colorByColumn: state    data:      type: io.kestra.plugin.core.dashboard.data.Executions      columns:        date:          field: START_DATE          displayName: Date        state:          field: STATE        total:          displayName: Executions          agg: COUNT          graphStyle: BARS        duration:          displayName: Duration          field: DURATION          agg: SUM          graphStyle: LINES      where:        - field: NAMESPACE          type: STARTS_WITH          value: data
  - id: executions_pie    type: io.kestra.plugin.core.dashboard.chart.Pie    chartOptions:      graphStyle: DONUT      displayName: Total Executions      description: Total executions per state      legend:        enabled: true      colorByColumn: state    data:      type: io.kestra.plugin.core.dashboard.data.Executions      columns:        state:          field: STATE        total:          agg: COUNT      where:        - field: NAMESPACE          type: STARTS_WITH          value: data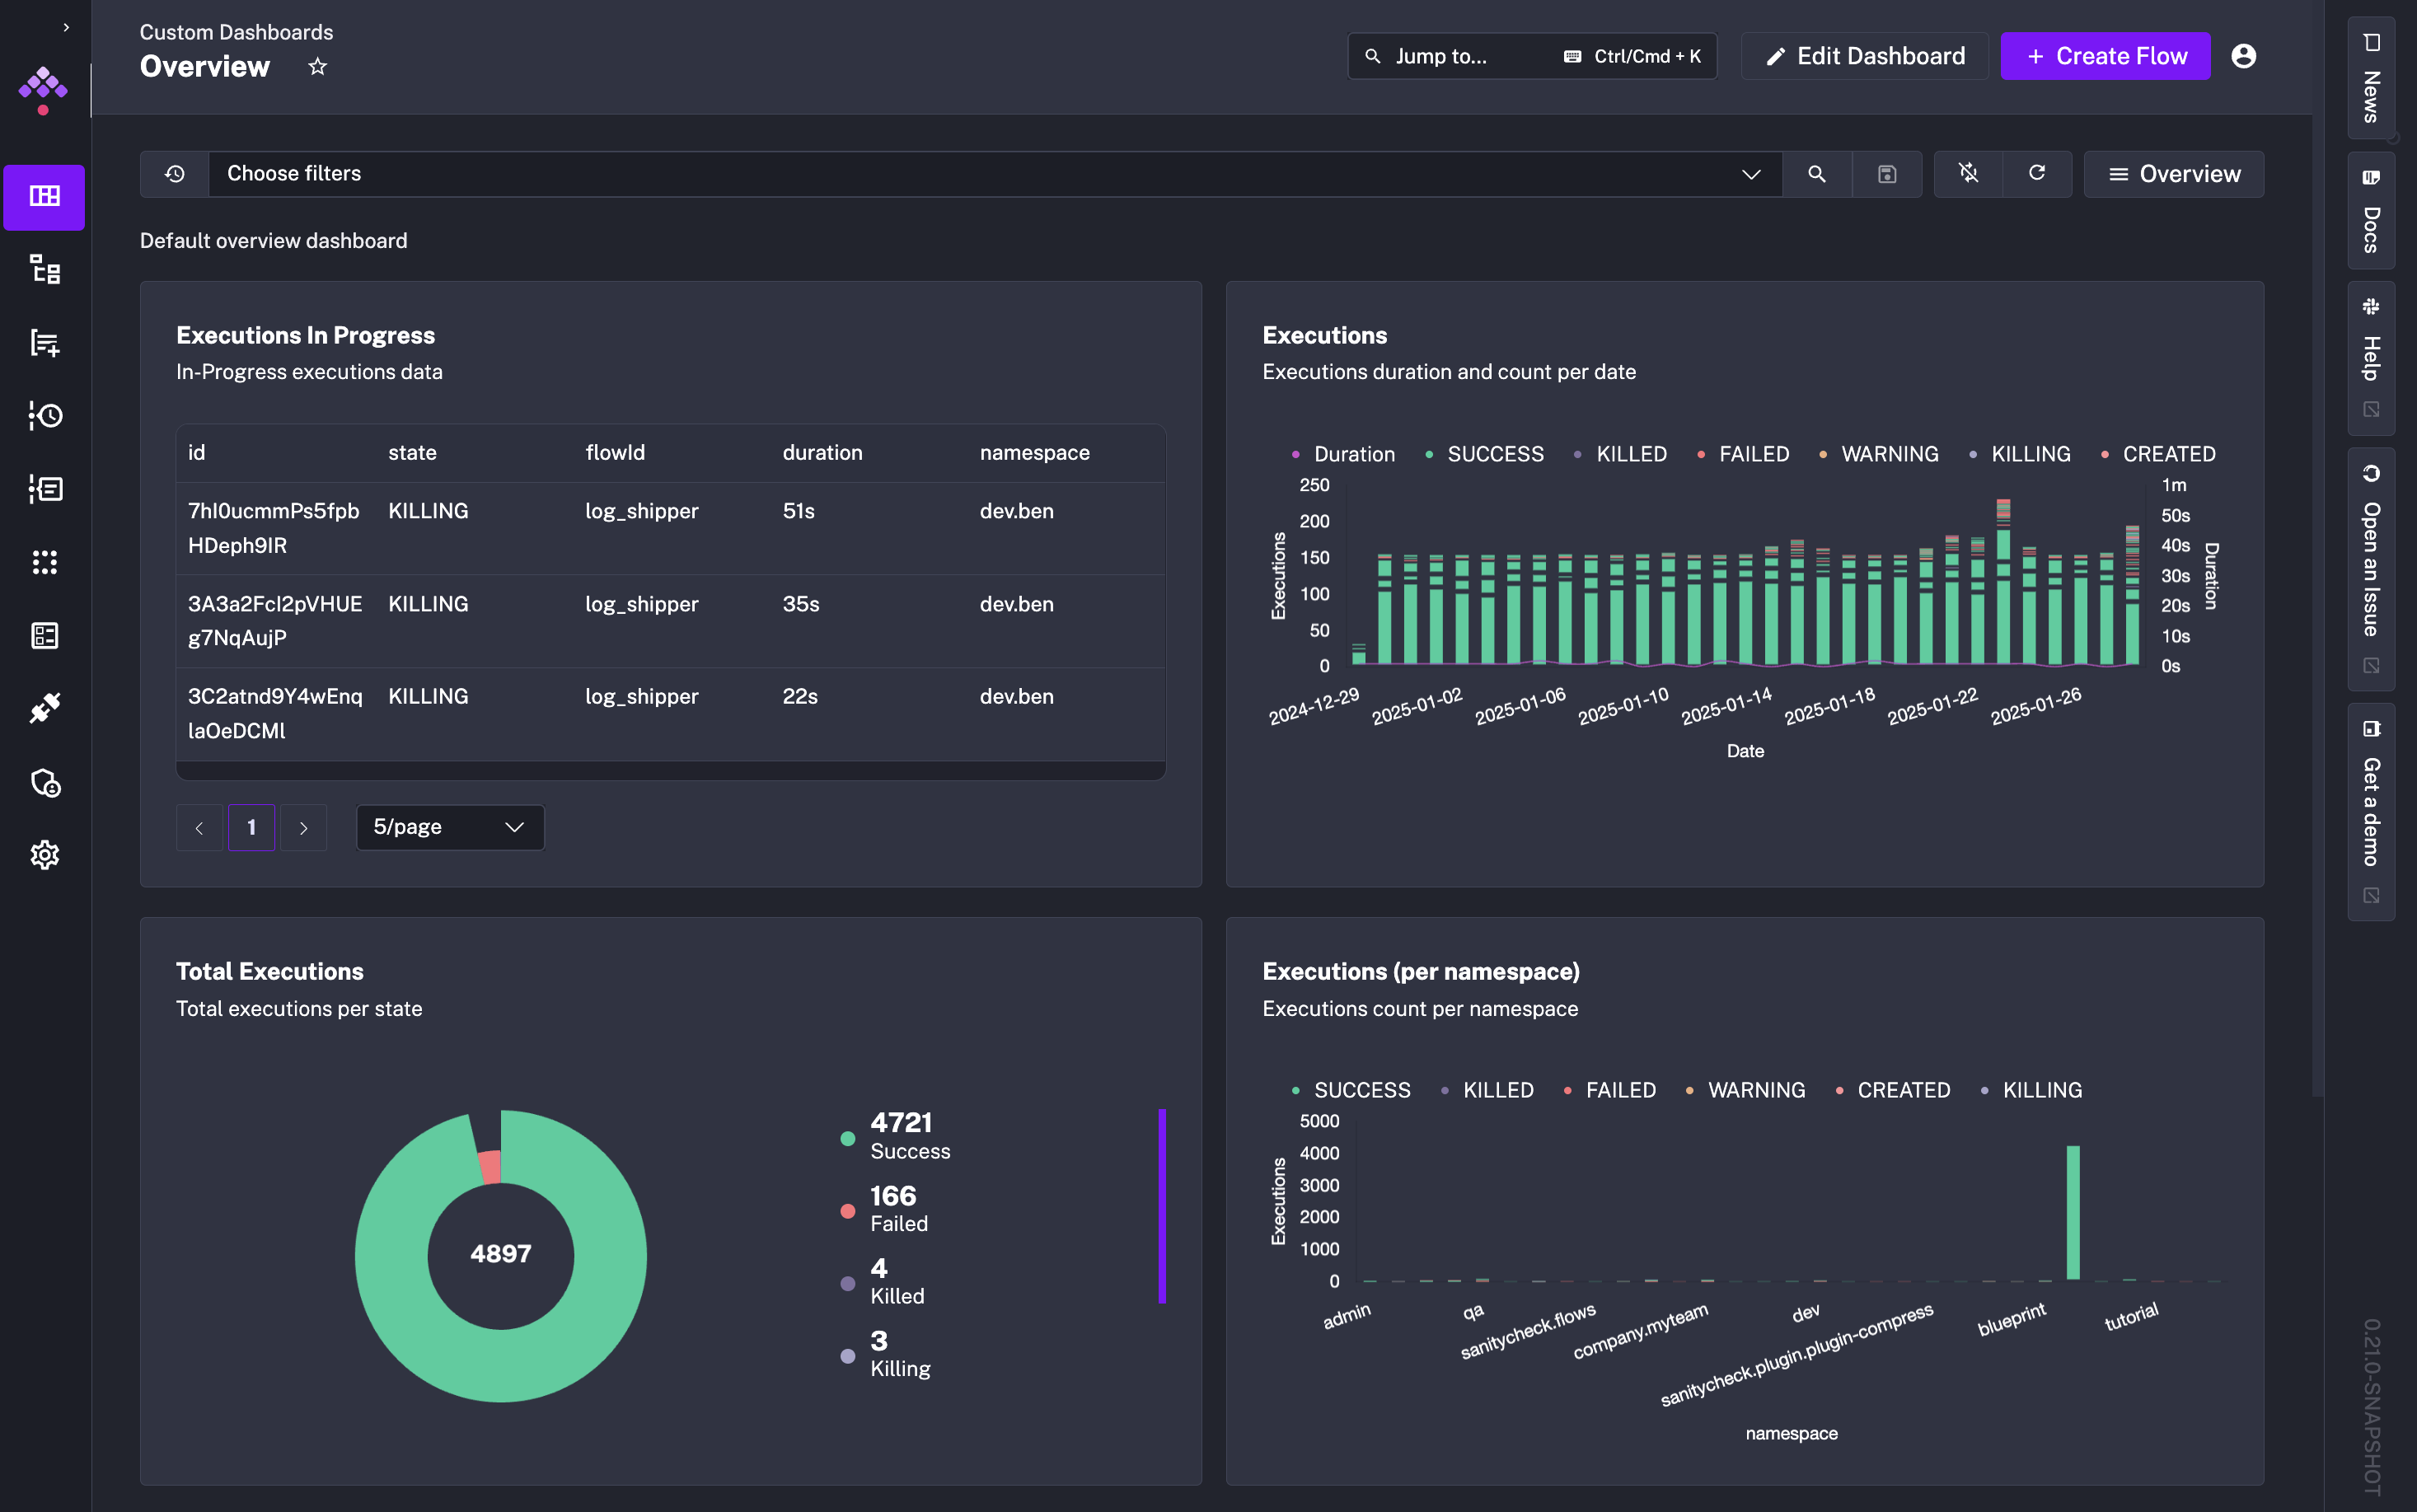
You can find Dashboard blueprints from the left side menu.
Maintenance Mode addresses a frequent challenge in environments running many workflows at scale: safely updating the platform without disrupting active operations. When enabled:
You can enter Maintenance Mode from the Administration > Instance panel.
finally Core PropertyWe’ve introduced a finally property that runs tasks at the end of a flow, regardless of prior task outcomes. It’s especially useful for cleanup steps like shutting down temporary resources spun up during a flow execution such as Docker containers or on-demand Spark clusters.
id: dockerRedisnamespace: company.team
variables:  host: host.docker.internal
tasks:  - id: start    type: io.kestra.plugin.docker.Run    containerImage: redis    wait: false    portBindings:      - "6379:6379"
  - id: sleep    type: io.kestra.plugin.core.flow.Sleep    duration: PT1S    description: Wait for the Redis container to start
  - id: set    type: io.kestra.plugin.redis.string.Set    url: "redis://:redis@{{vars.host}}:6379/0"    key: "key_string_{{execution.id}}"    value: "{{flow.id}}"    serdeType: STRING
  - id: get    type: io.kestra.plugin.redis.string.Get    url: "redis://:redis@{{vars.host}}:6379/0"    key: "key_string_{{execution.id}}"    serdeType: STRING
  - id: assert    type: io.kestra.plugin.core.execution.Assert    errorMessage: "Invalid get data {{outputs.get}}"    conditions:      - "{{outputs.get.data == flow.id}}"
  - id: delete    type: io.kestra.plugin.redis.string.Delete    url: "redis://:redis@{{vars.host}}:6379/0"    keys:      - "key_string_{{execution.id}}"
  - id: getAfterDelete    type: io.kestra.plugin.redis.string.Get    url: "redis://:redis@{{vars.host}}:6379/0"    key: "key_string_{{execution.id}}"    serdeType: STRING
  - id: assertAfterDelete    type: io.kestra.plugin.core.execution.Assert    errorMessage: "Invalid get data {{outputs.getAfterDelete}}"    conditions:      - "{{(outputs.getAfterDelete contains 'data') == false}}"
finally: - id: stop type: io.kestra.plugin.docker.Stop containerId: "{{outputs.start.taskRunner.containerId}}"As with each release, there are more UI and UX enhancements:
taskrun.iteration property.We’ve fixed an issue preventing DuckDB upgrades. Kestra now supports the latest DuckDB version.
Exit core taskThe Exit task allows you to terminate an execution in a given state based on a custom condition.
id: exitnamespace: company.team
inputs:  - id: state    type: SELECT    values:      - CONTINUE      - END    defaults: CONTINUE
tasks:  - id: if    type: io.kestra.plugin.core.flow.If    condition: "{{inputs.state == 'CONTINUE'}}"    then:      - id: continue        type: io.kestra.plugin.core.log.Log        message: Show must go on...    else:      - id: exit        type: io.kestra.plugin.core.execution.Exit        state: KILLED
- id: end type: io.kestra.plugin.core.log.Log message: This is the endWrite taskThe Write task takes your string input and saves it as a file in Kestra’s internal storage. The task returns a URI pointing to the newly created file, which you can reference in subsequent tasks e.g., to upload the file to an S3 bucket.
id: write_filenamespace: company.team
tasks:  - id: write    type: io.kestra.plugin.core.storage.Write    content: Hello World    extension: .txt
- id: s3 type: io.kestra.plugin.aws.s3.Upload from: "{{ outputs.write.uri }}" bucket: kestraio key: data/myfile.txtThe new huggingface.Inference task integrates with the HuggingFace Inference API, letting you incorporate LLM-based capabilities into your Kestra workflows.
id: hugging_facenamespace: blueprint
inputs:  - id: message    type: STRING
tasks:  - id: classification    type: io.kestra.plugin.huggingface.Inference    model: facebook/bart-large-mnli    apiKey: "{{ secret('HUGGINGFACE_API_KEY') }}"    inputs: "{{ inputs.message }}"    parameters:        candidate_labels:          - "support"          - "warranty"          - "upsell"          - "help"
- id: log type: io.kestra.plugin.core.log.Log message: "The input is categorized as a {{ json(outputs.classification.output).labels[0] }} message."The AWS EMR plugin lets you create or terminate AWS EMR clusters and manage jobs.
id: aws_emrnamespace: company.team
tasks: - id: create_cluster type: io.kestra.plugin.aws.emr.CreateCluster accessKeyId: {{ secret('AWS_ACCESS_KEY') }} secretKeyId: {{ secret('AWS_SECRET_KEY') }} region: eu-west-3 clusterName: "Spark_job_cluster" logUri: "s3://kestra-test/test-emr-logs" keepJobFlowAliveWhenNoSteps: true applications: - Spark masterInstanceType: m5.xlarge slaveInstanceType: m5.xlarge instanceCount: 3 ec2KeyName: test-key-pair steps: - name: Spark_job_test jar: "command-runner.jar" actionOnFailure: CONTINUE commands: - spark-submit s3://kestra-test/health_violations.py --data_source s3://kestra-test/food_establishment_data.csv --output_uri s3://kestra-test/test-emr-output wait: falserandomInt to generate a random integer.uuid to generate a UUID.distinct to get a unique set of values from an array (e.g., ['1', '1', '2', '3'] | distinct returns ['1', '2', '3']).Thank you to everyone who contributed to this release through feedback, bug reports, and pull requests. If you want to become a Kestra contributor, check out our Contributing Guide and the list of good first issues.
This post covered new features and enhancements added in Kestra 0.21.0. Which of them are your favorites? What should we add next? Your feedback is always appreciated.
If you have any questions, reach out via Slack or open a GitHub issue.
If you like the project, give us a GitHub star ⭐️ and join the community.

Stay up to date with the latest features and changes to Kestra