Monitor Workflows with Kestra Dashboards
For the complete documentation index, see llms.txt. For a full content snapshot, see llms-full.txt. Append.mdto anykestra.io/docs/*URL for plain Markdown.
Get insights into your workflows with Dashboards.
The first time you access the main Dashboard, you'll see the Welcome Page and you can click Create my first flow to launch a Guided Tour.
Once you have executed a flow, you will see your flow executions in the dashboard.
Dashboard page
The Dashboard page displays both the default dashboard and any custom dashboards you've created. To switch between dashboards, use the hamburger menu. If you have over 10 dashboards, type the dashboard name in the search bar to quickly find it. The same menu also lets you edit or delete existing dashboards. From your dashboard, you can apply and save filters, refresh data, and set an automatic periodic refresh.
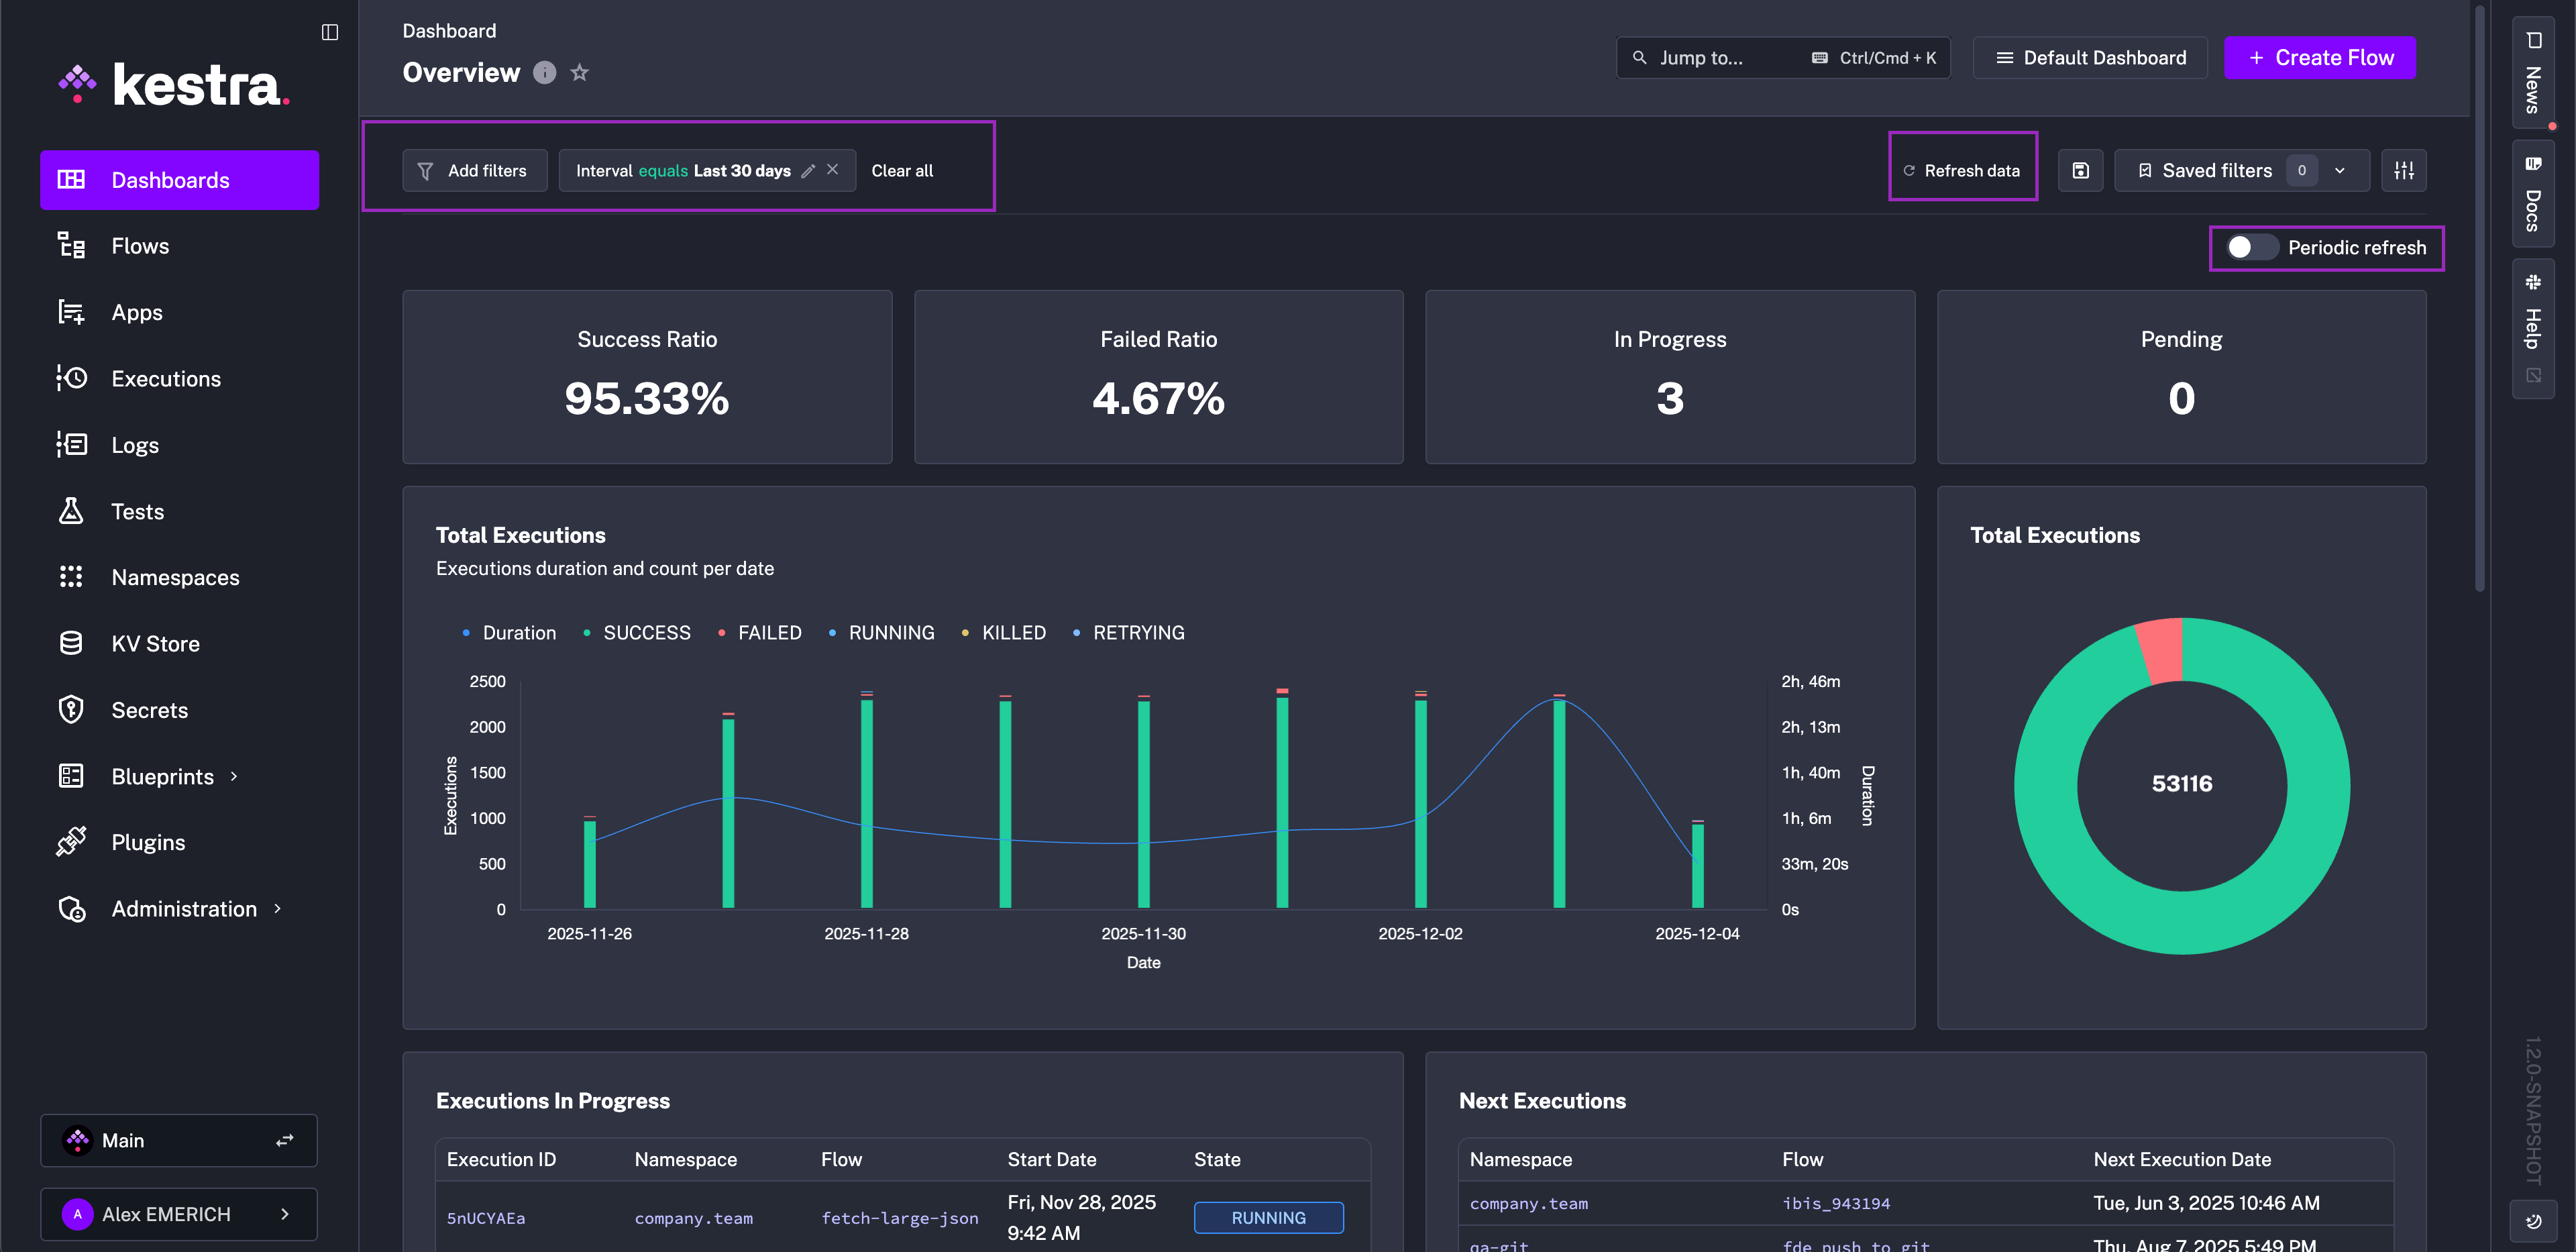
Dashboards display the following data:
- Executions over time
- Execution Status for Today, Yesterday as well as Last 30 days
- Executions per namespace
- Execution errors per namespace
- List of failed Executions
- List of error logs
- A ratio of execution successes to total executions
Custom dashboards
Dashboards let you define custom queries and charts to visualize data on your executions, logs, and metrics. Rather than relying only on the default dashboard on Kestra's home screen, you can create a custom dashboard with charts that answer specific questions and track key metrics. Each chart's configuration can be modified individually using the pencil icon in the dashboard view.
You can build custom dashboards using the No Code editor (form-based, no YAML required) or by writing YAML directly. Both produce the same schema-validated output.
No Code editor
The No Code editor lets you design dashboards directly in the UI using structured forms. As you configure charts and data sources, the editor generates YAML in real time and stays synchronized with the live preview — switch between views at any time.
- Speed & accessibility: Build dashboards without writing YAML — ideal for analysts, operators, or anyone new to Kestra.
- Visual clarity: Live previews let you see your dashboard evolve as you edit.
- No ceiling: Switch to YAML when you need filters, dynamic queries, or advanced layout logic — all in the same editor.
Interactive demo
Quick start
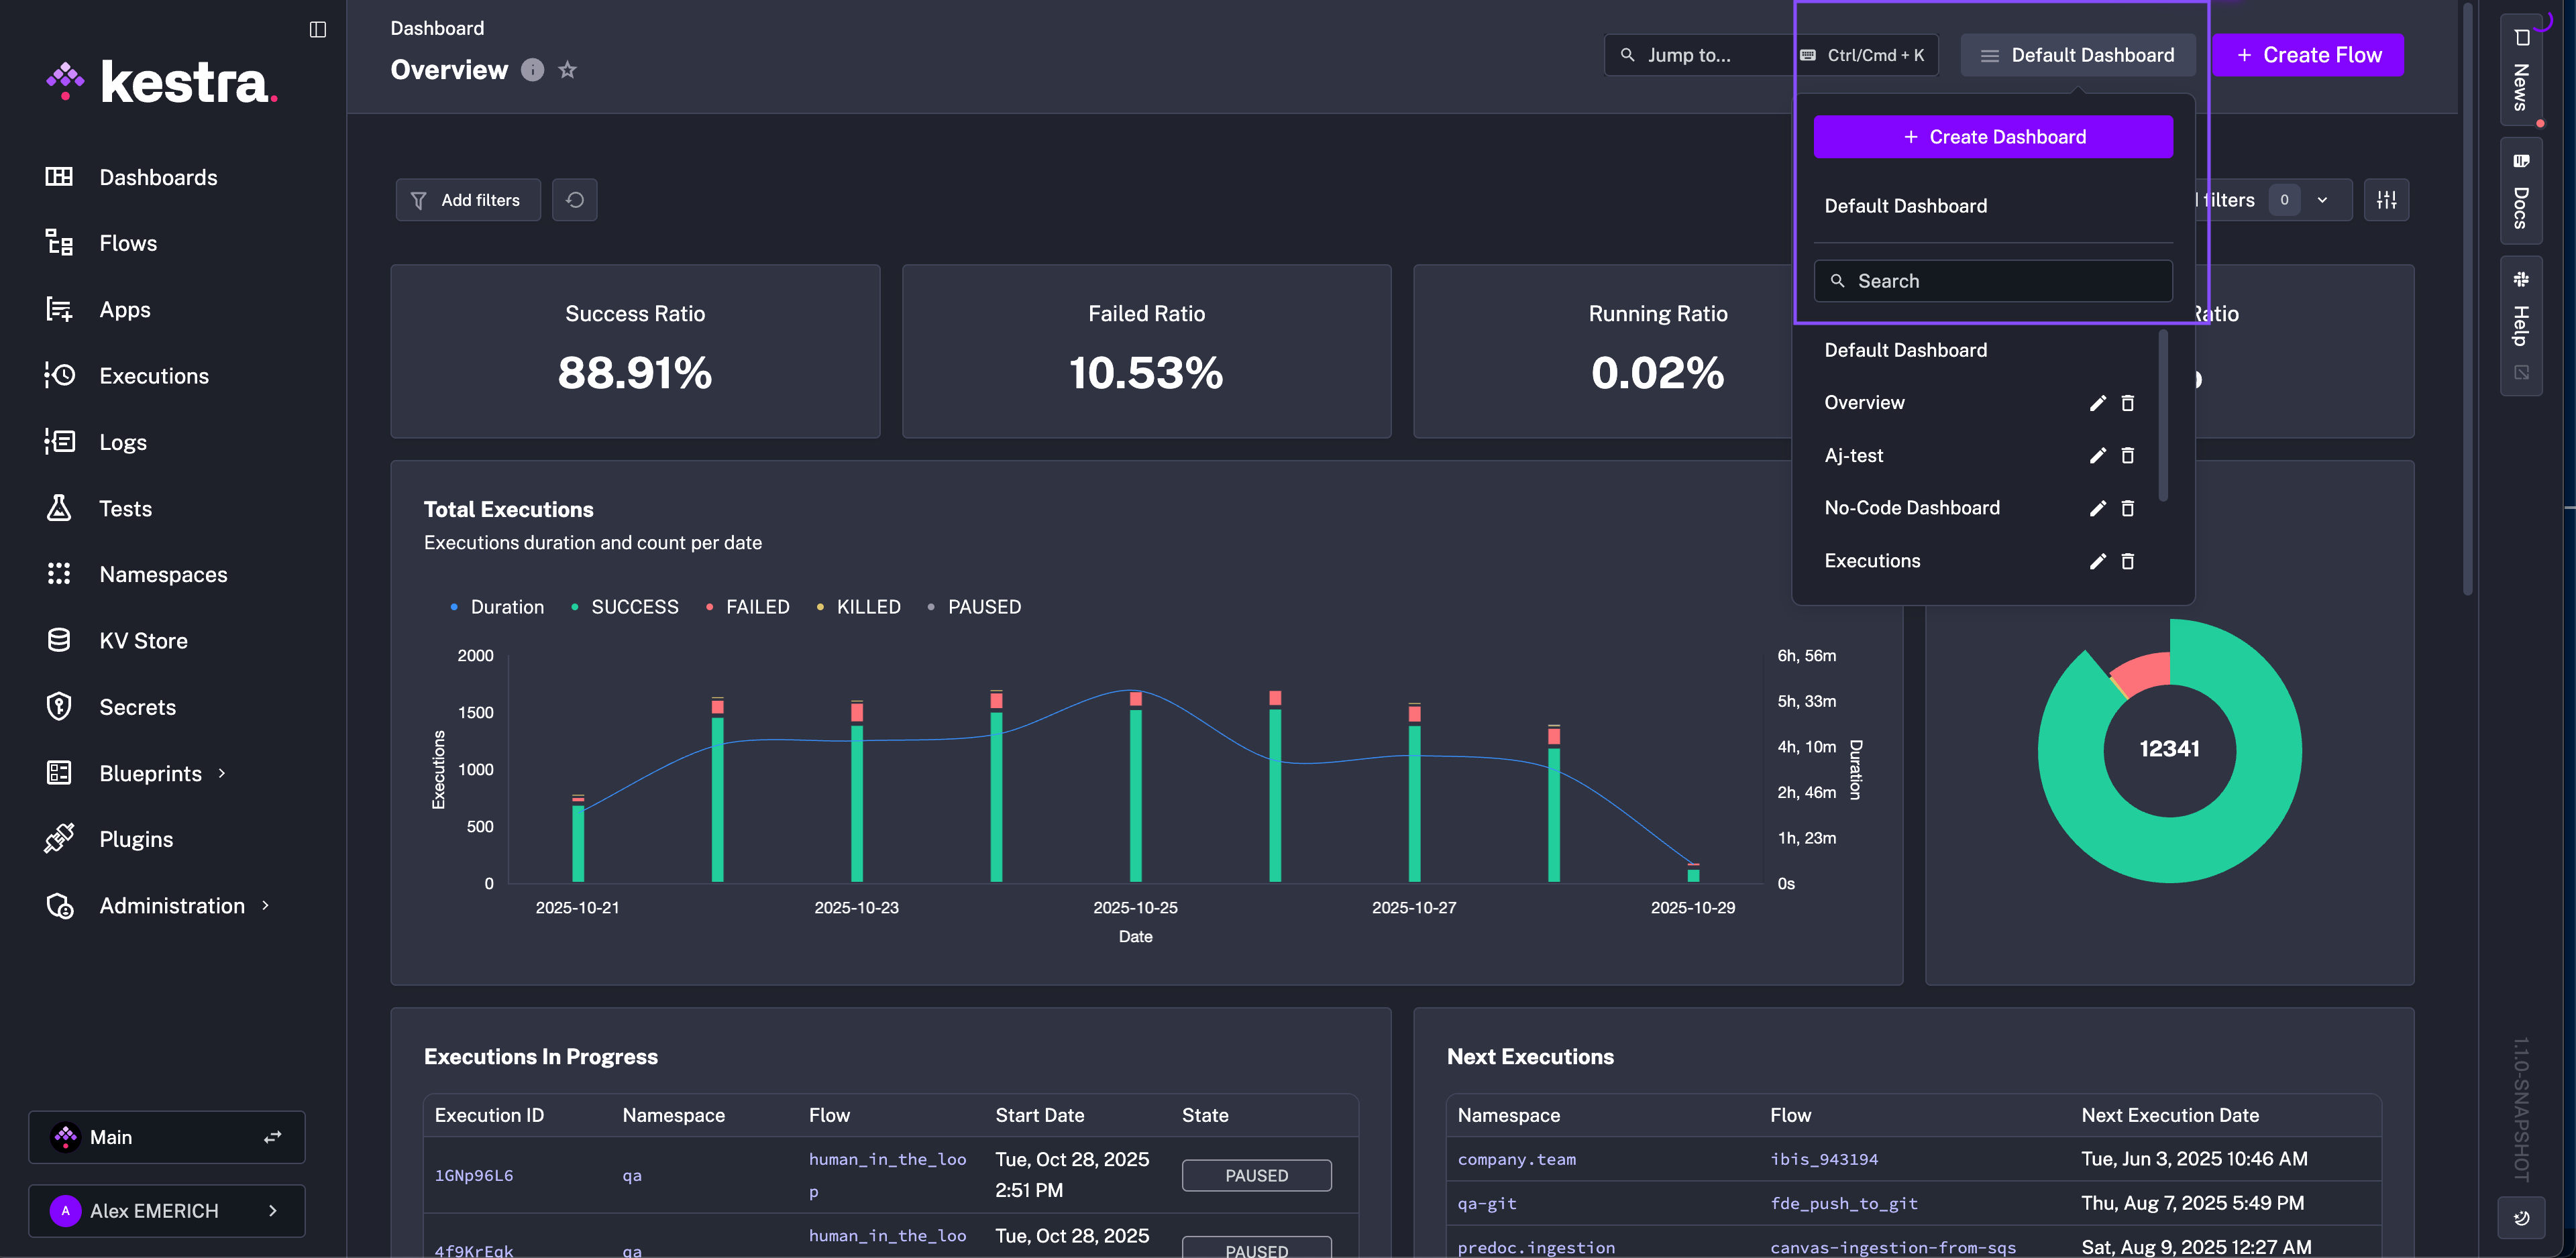
Navigate to the Dashboards tab, click Default Dashboard, and select + Create Dashboard.
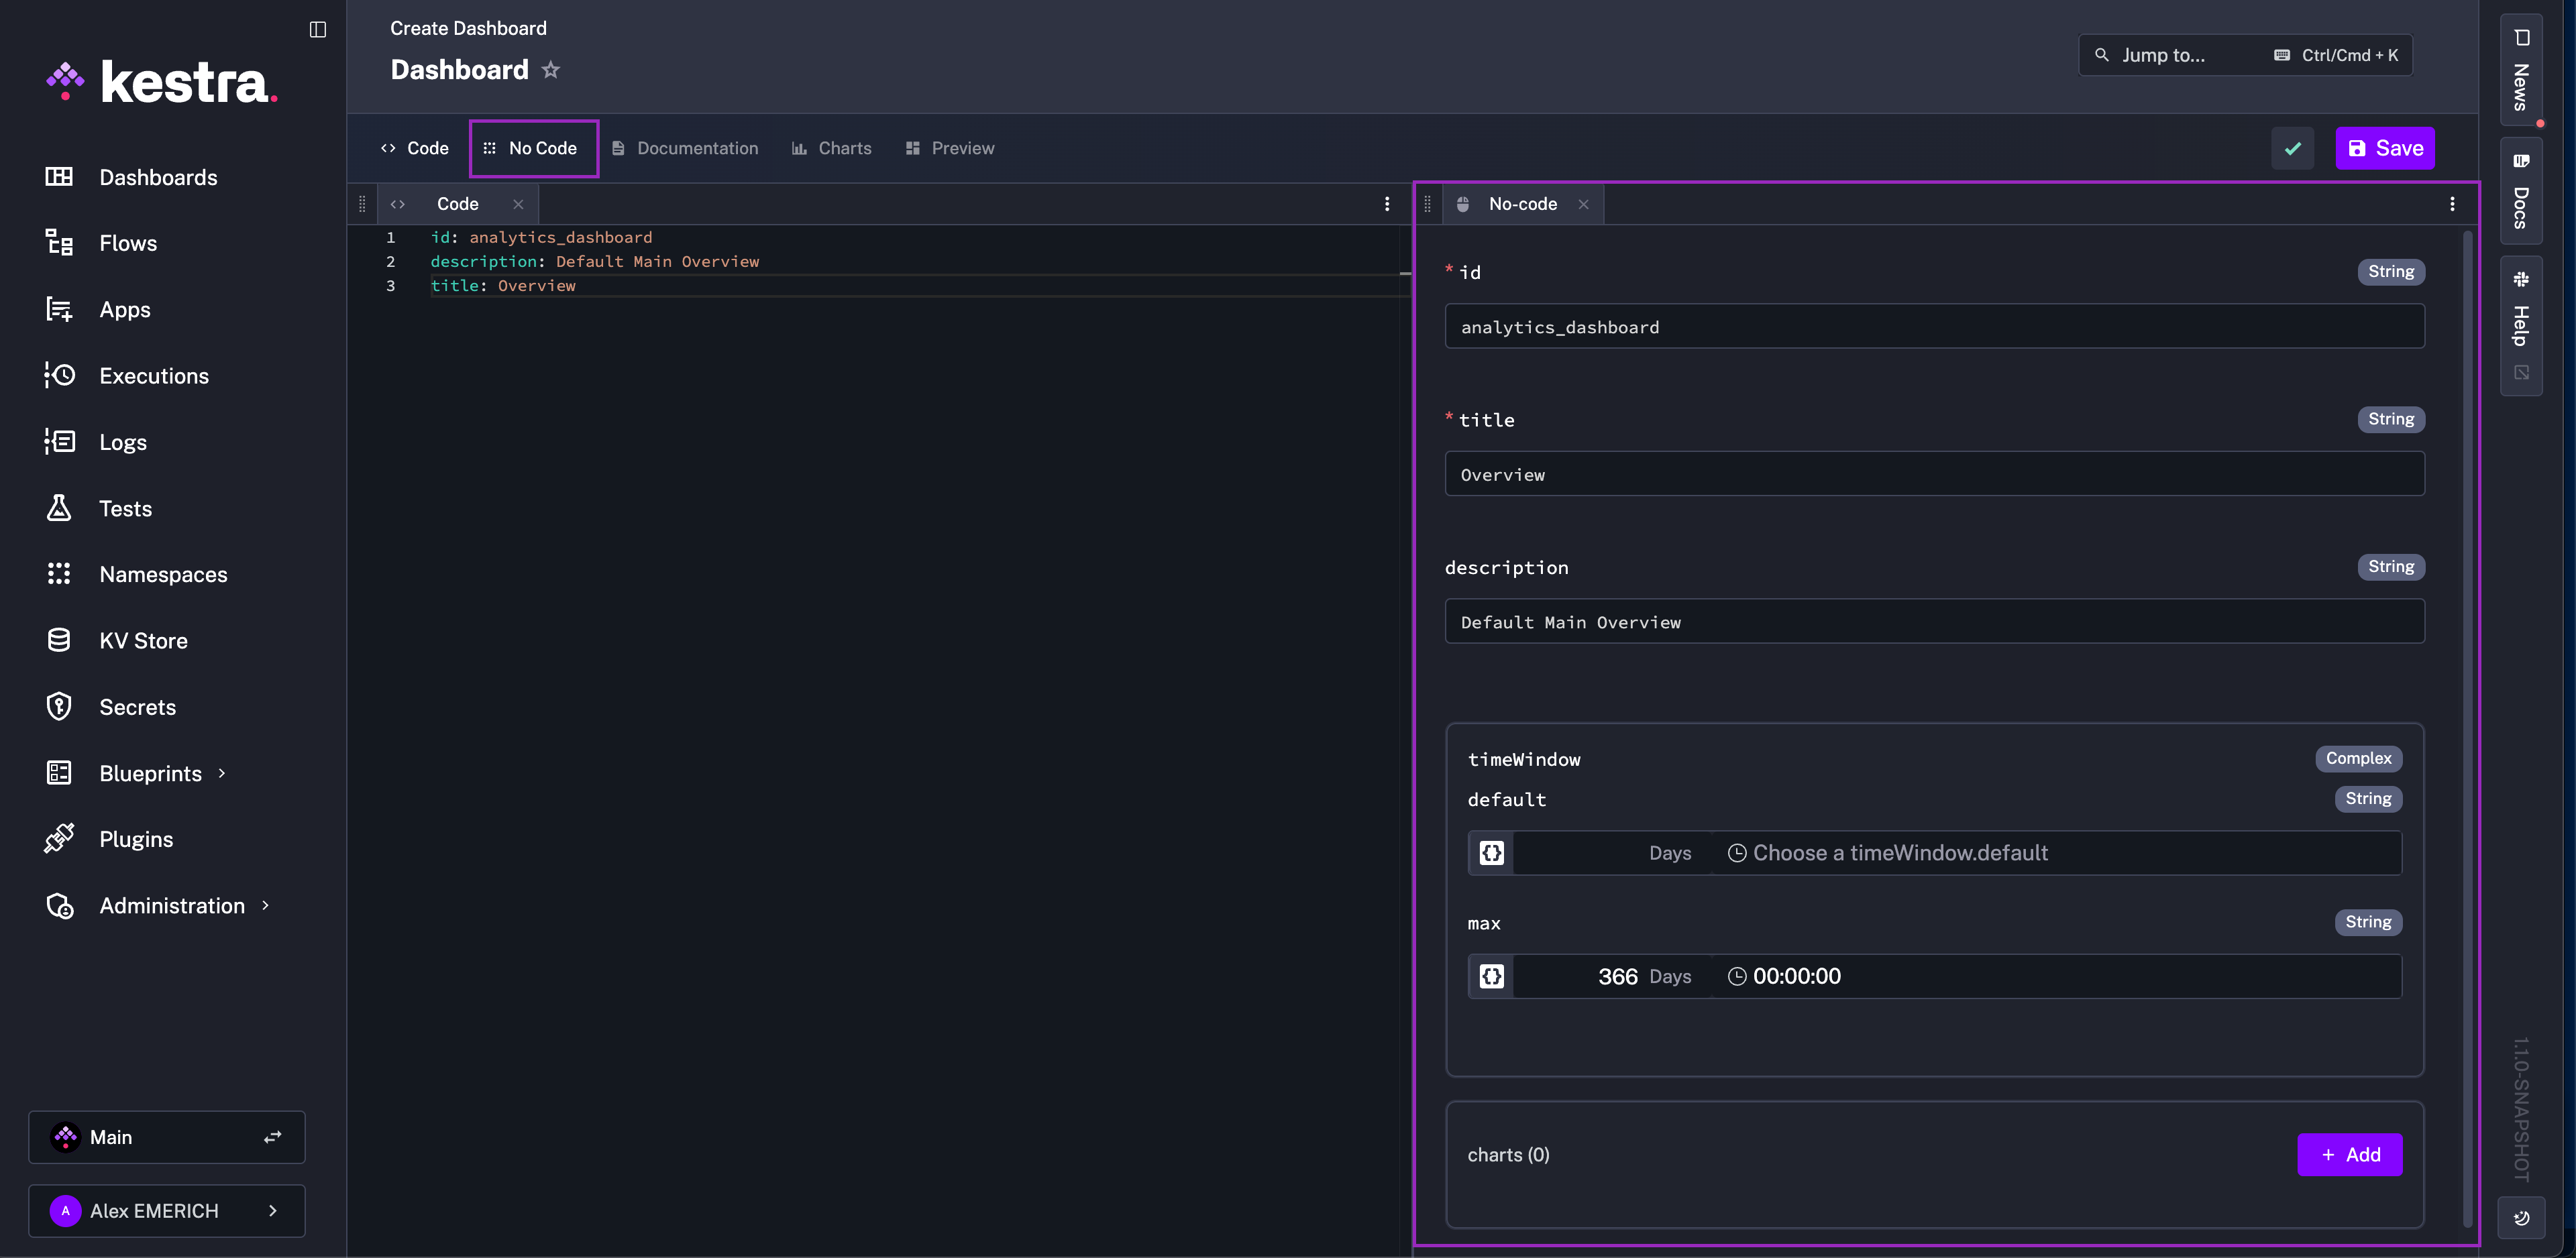
In the Dashboard YAML editor, select the No Code tab. It appears alongside the YAML editor so you can view both as you work.
Example: build a KPI success ratio chart
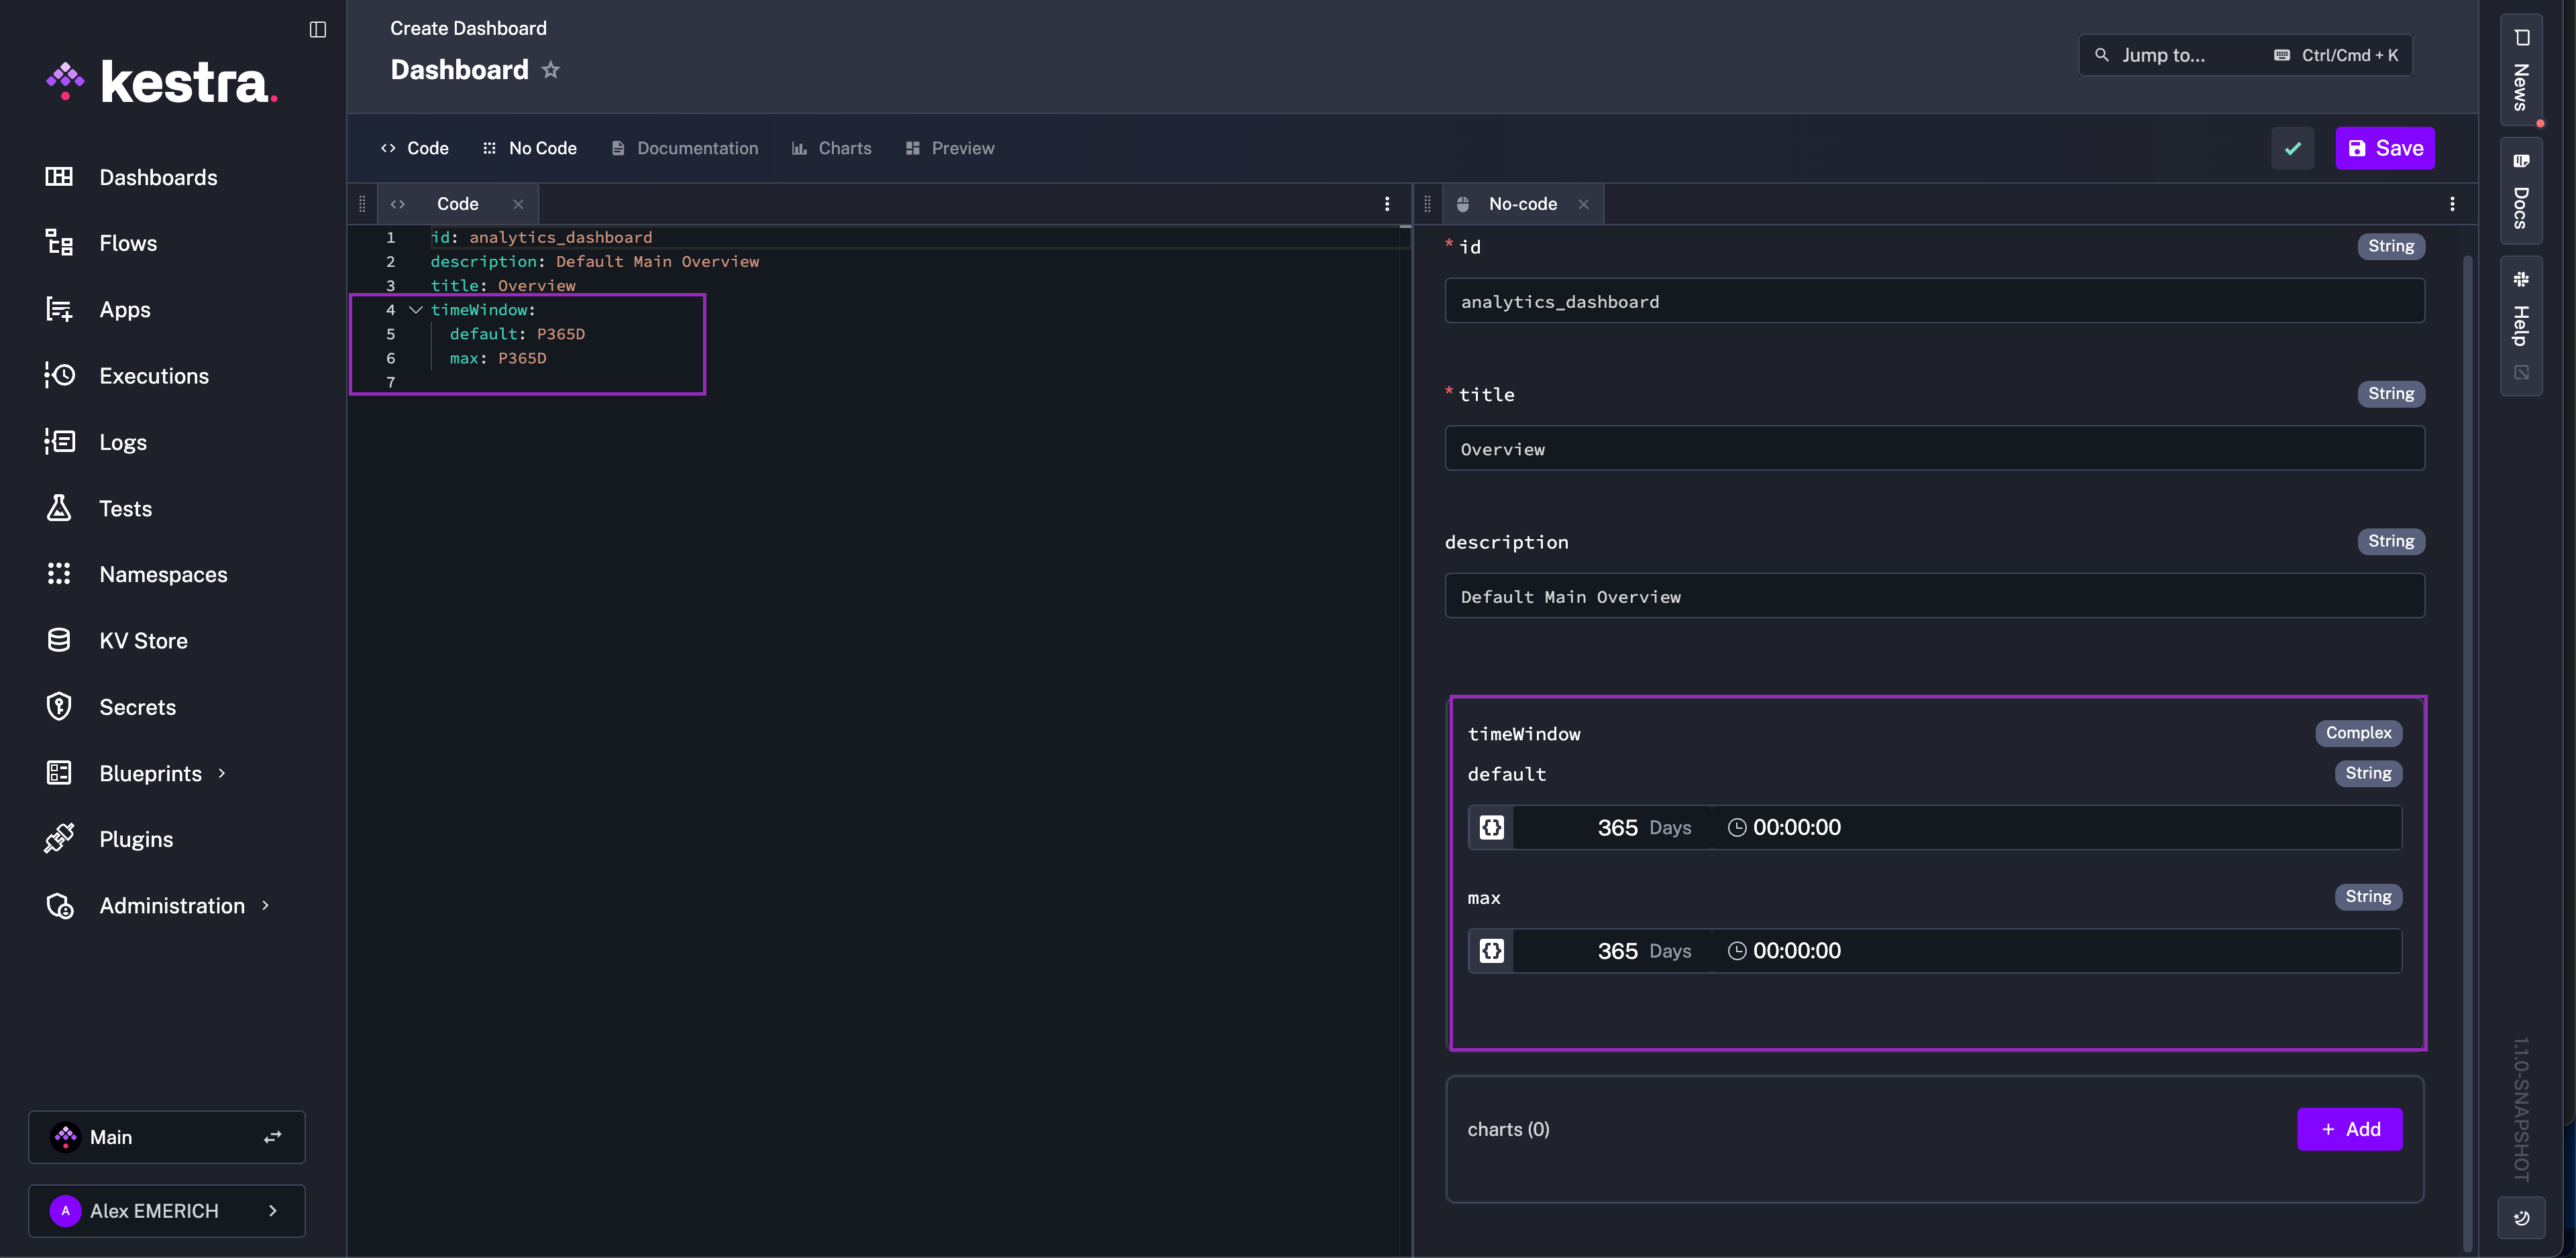
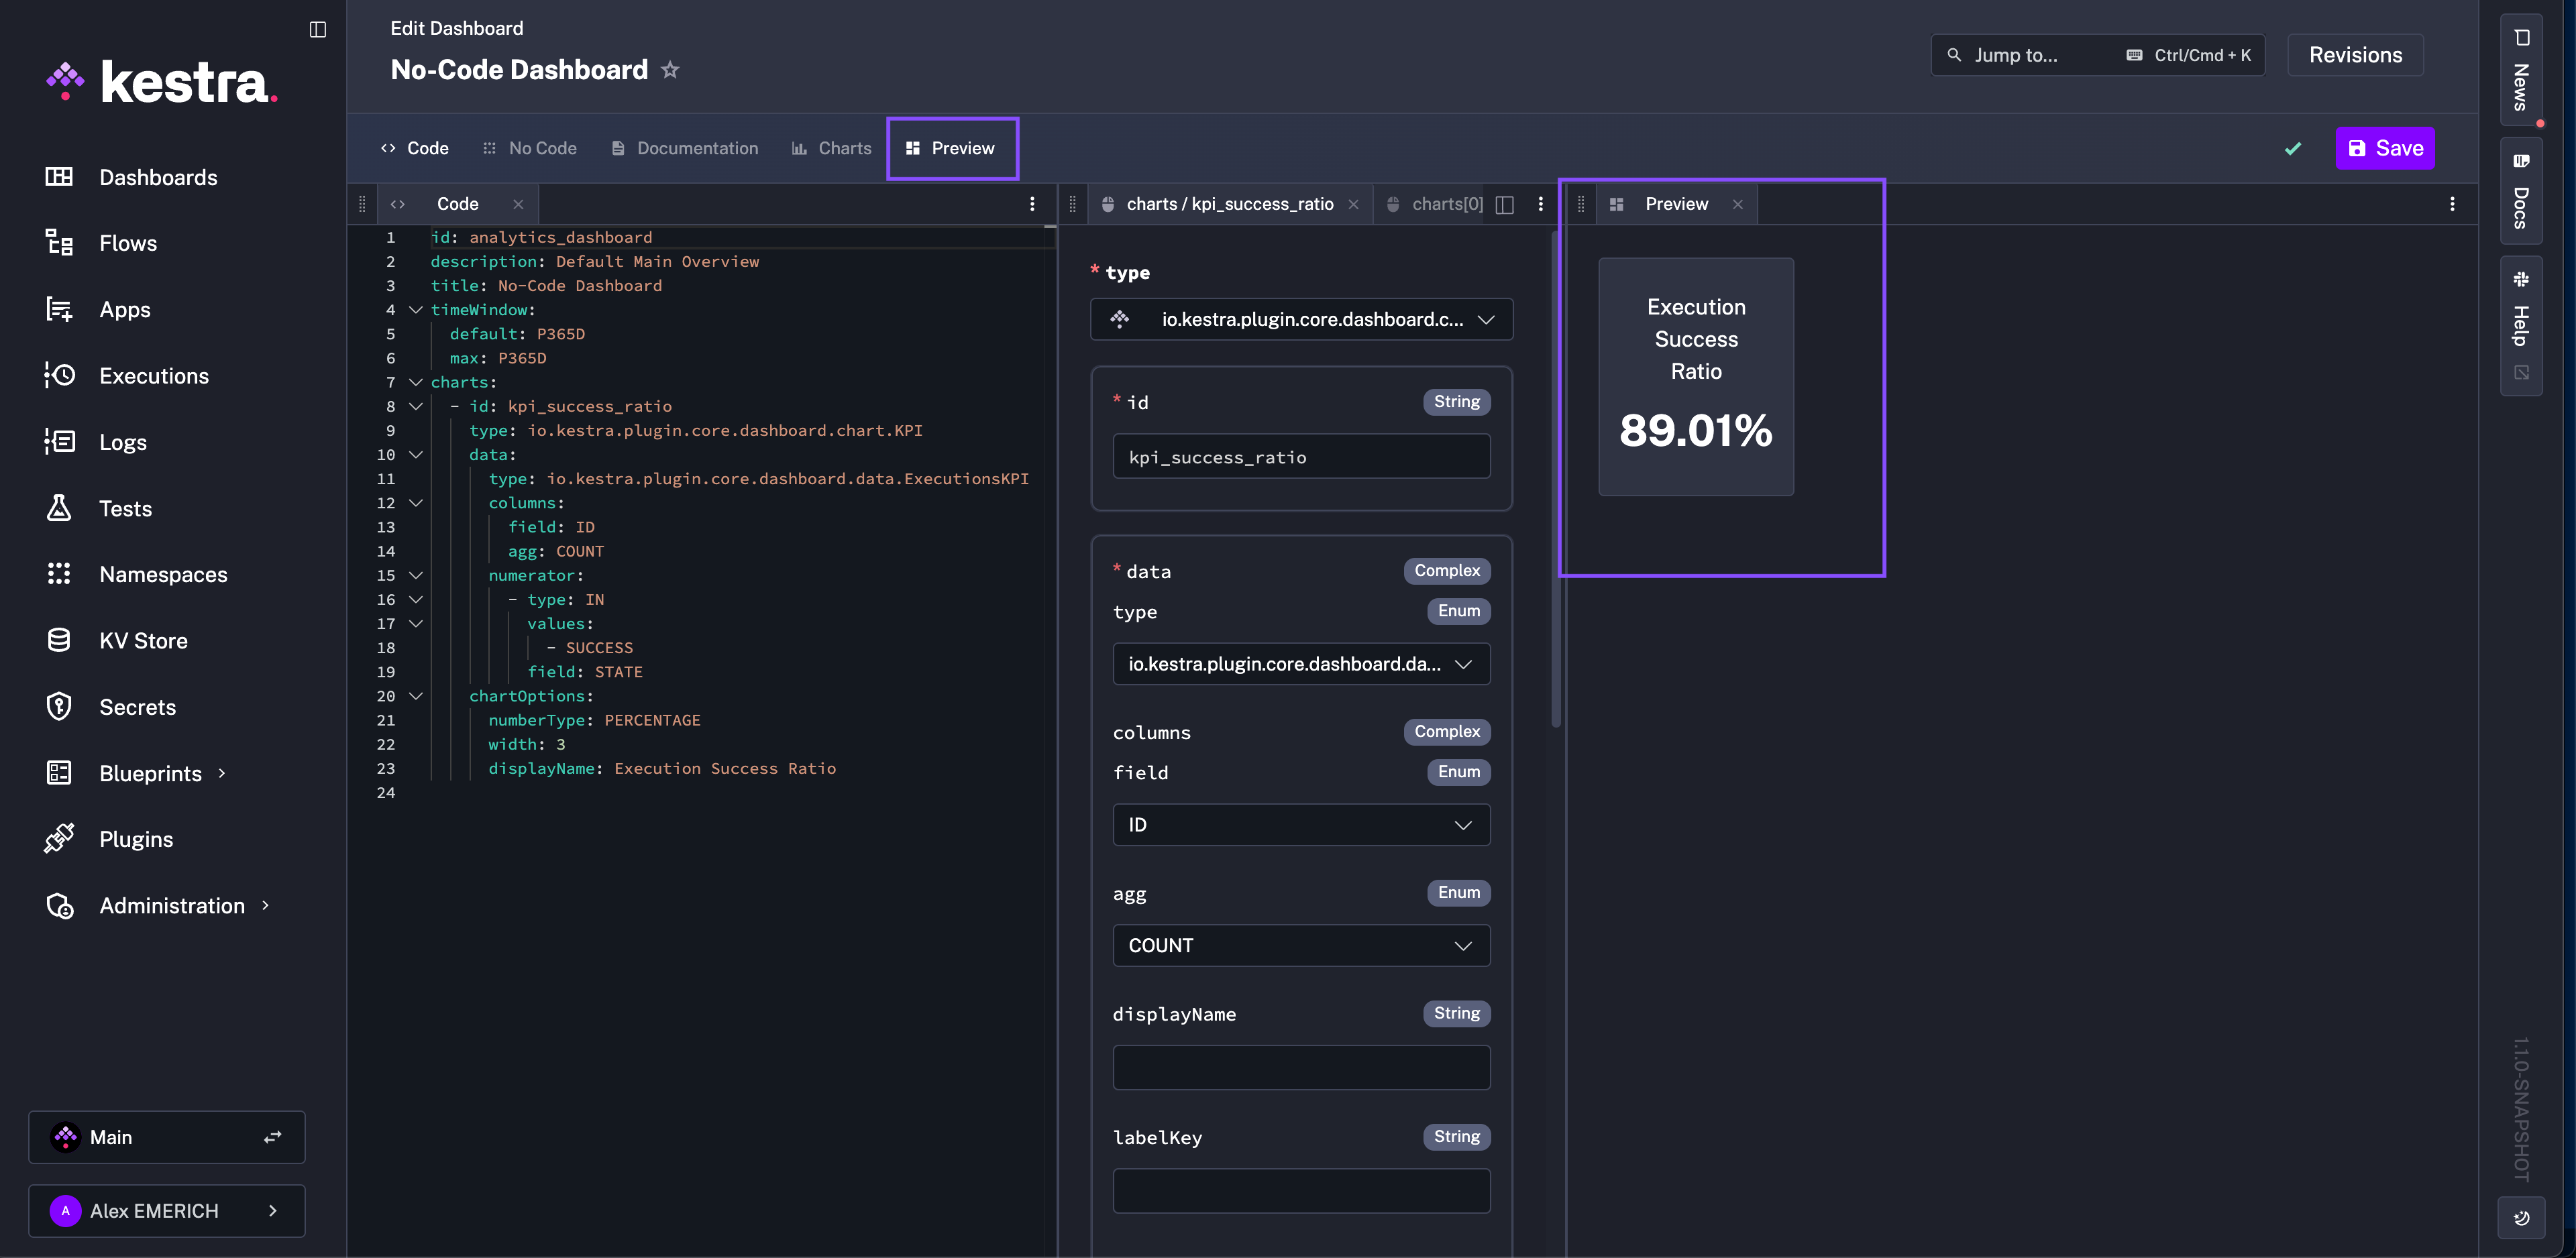
Give your dashboard an ID, title, description, and time window. Changes in No Code forms immediately reflect in the YAML editor.
Click + Add in the charts block to create your first chart. Choose KPI Chart as the chart type. Each type has its own options — see the Chart Plugin documentation for the full list. Open the Documentation tab at any time to view chart-specific guidance without leaving the editor.
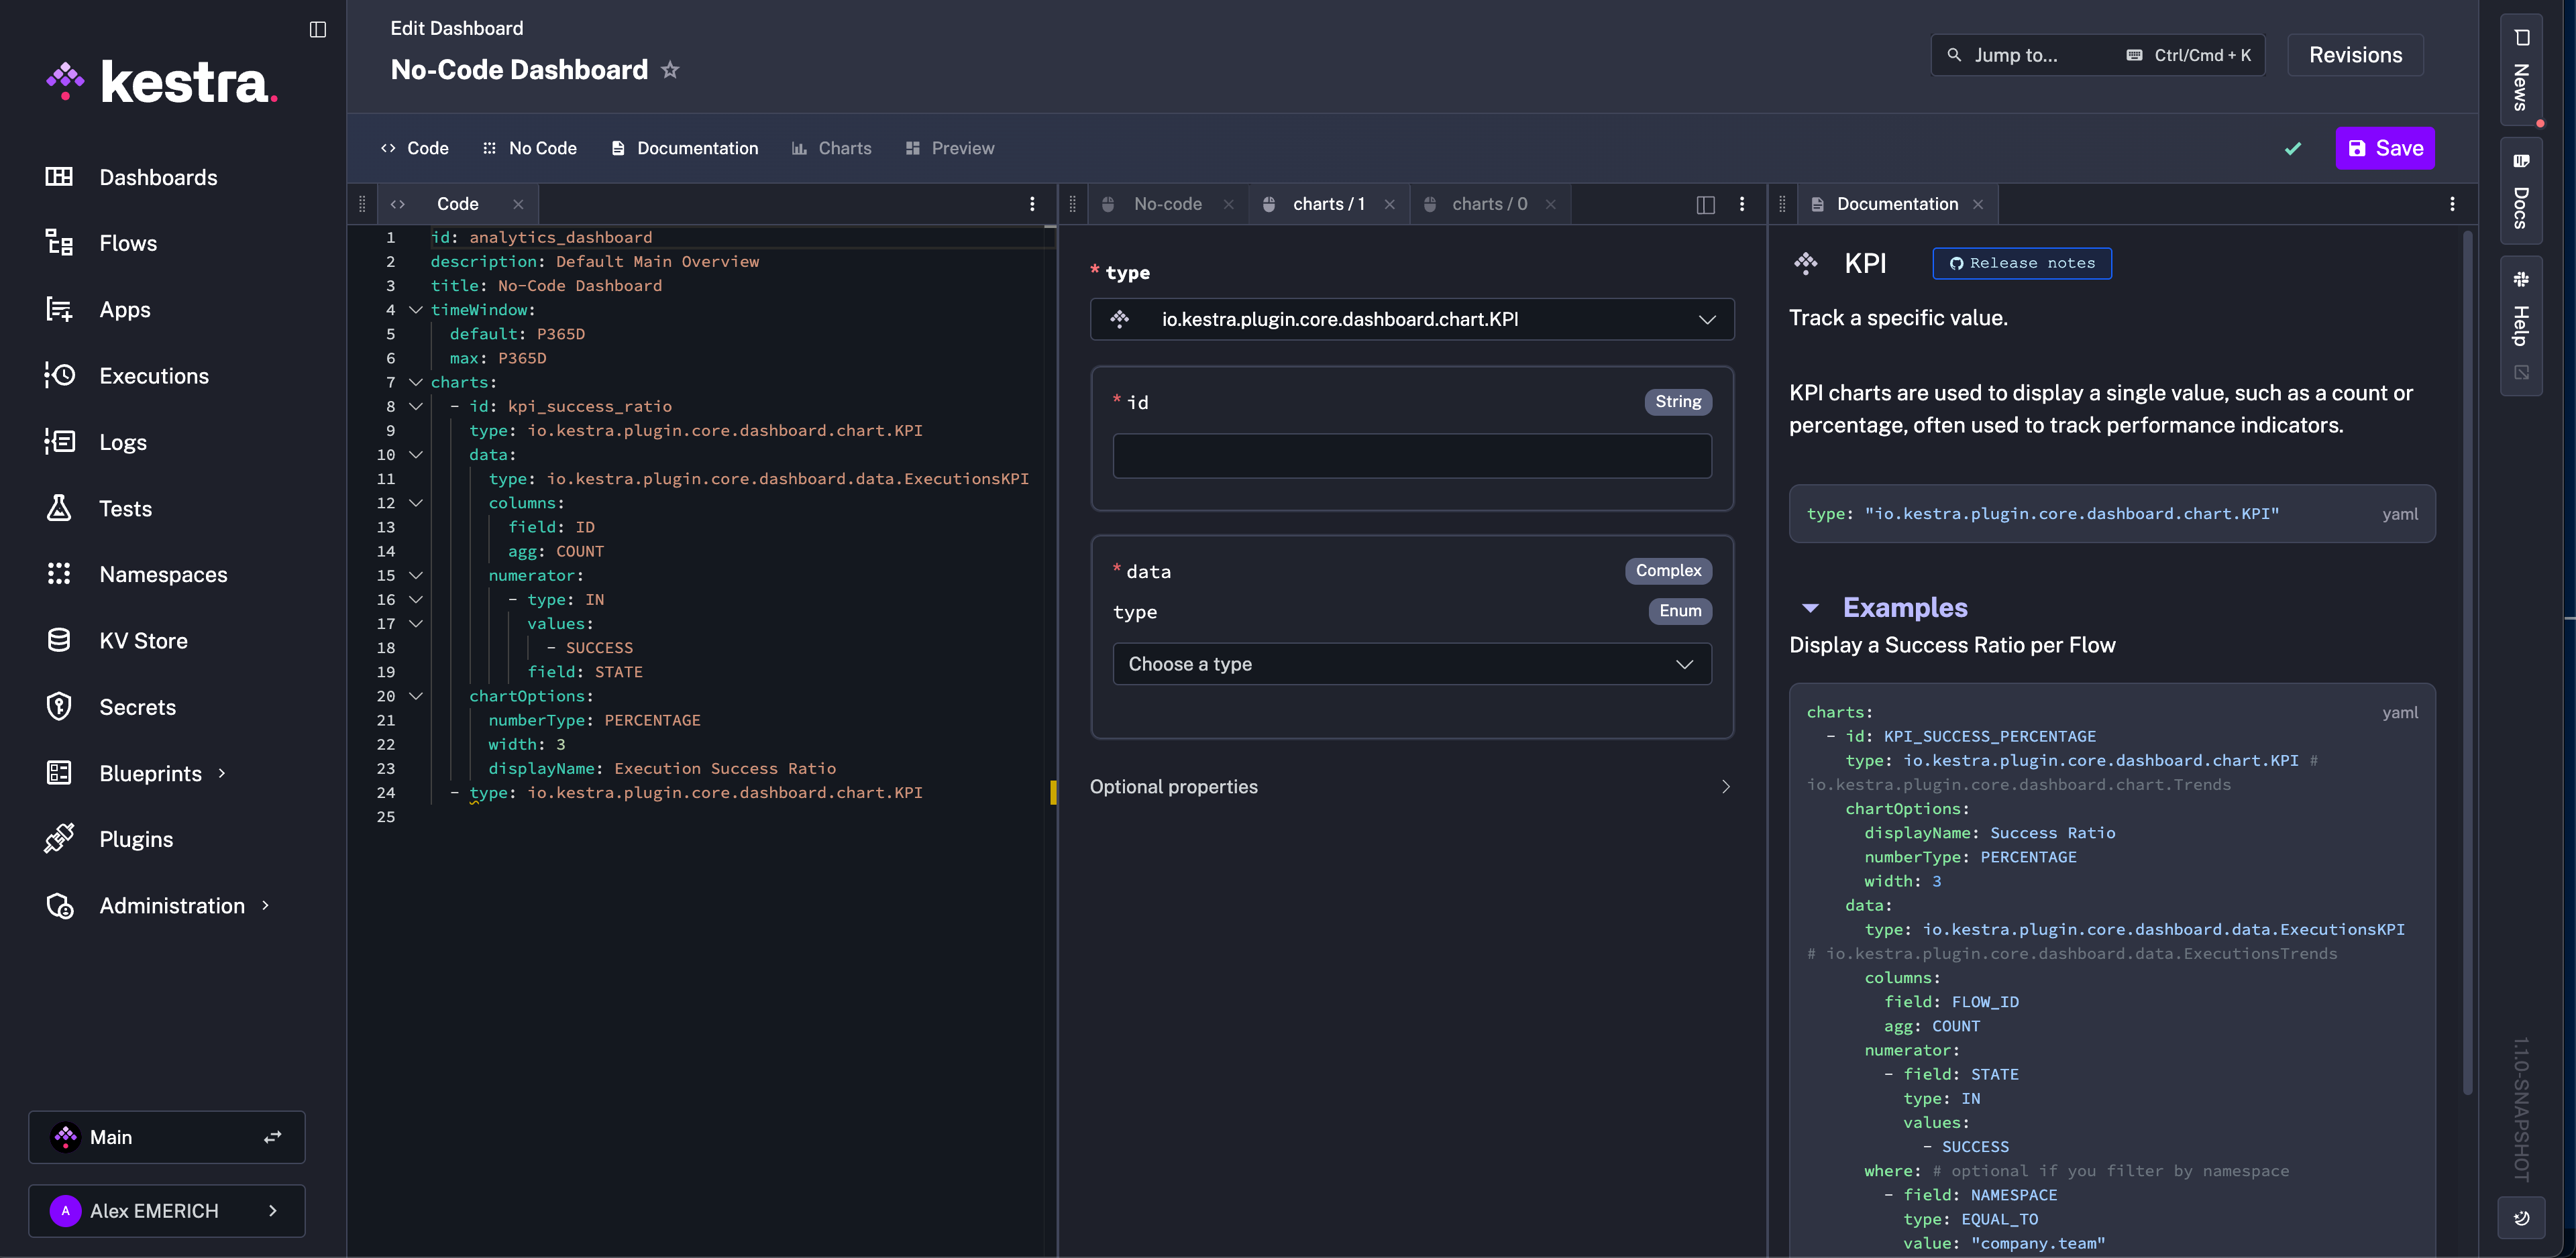
Give the chart an ID and set the data type to Executions. Set field to ID and agg to COUNT to capture all executions. Optionally add a display name.
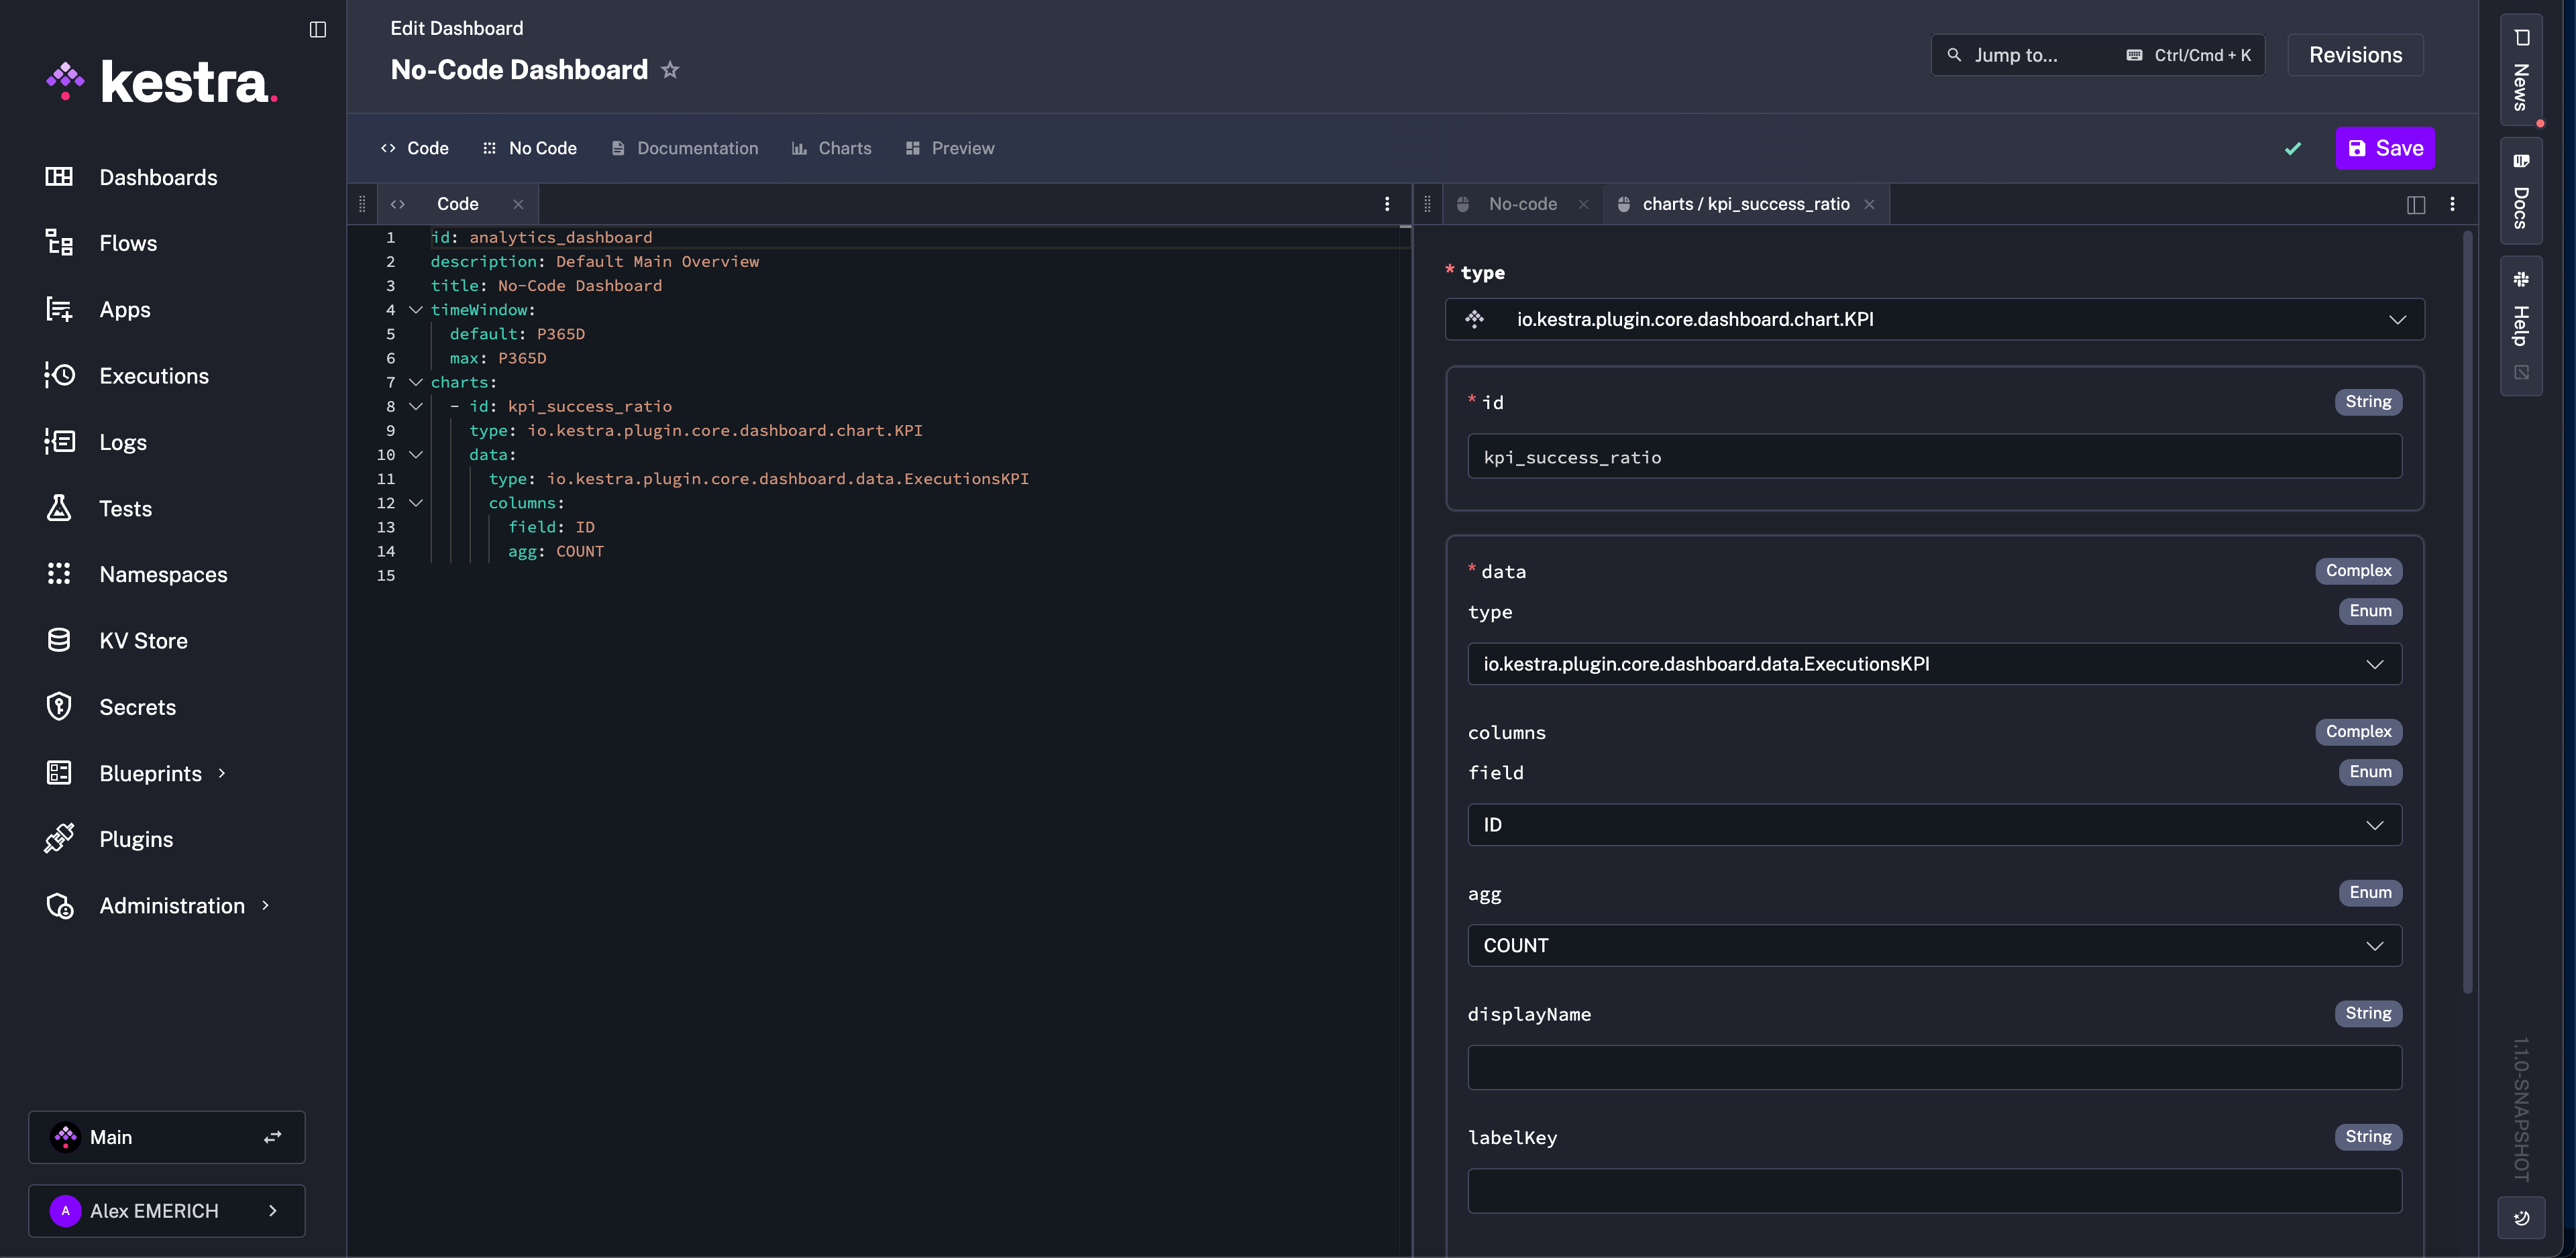
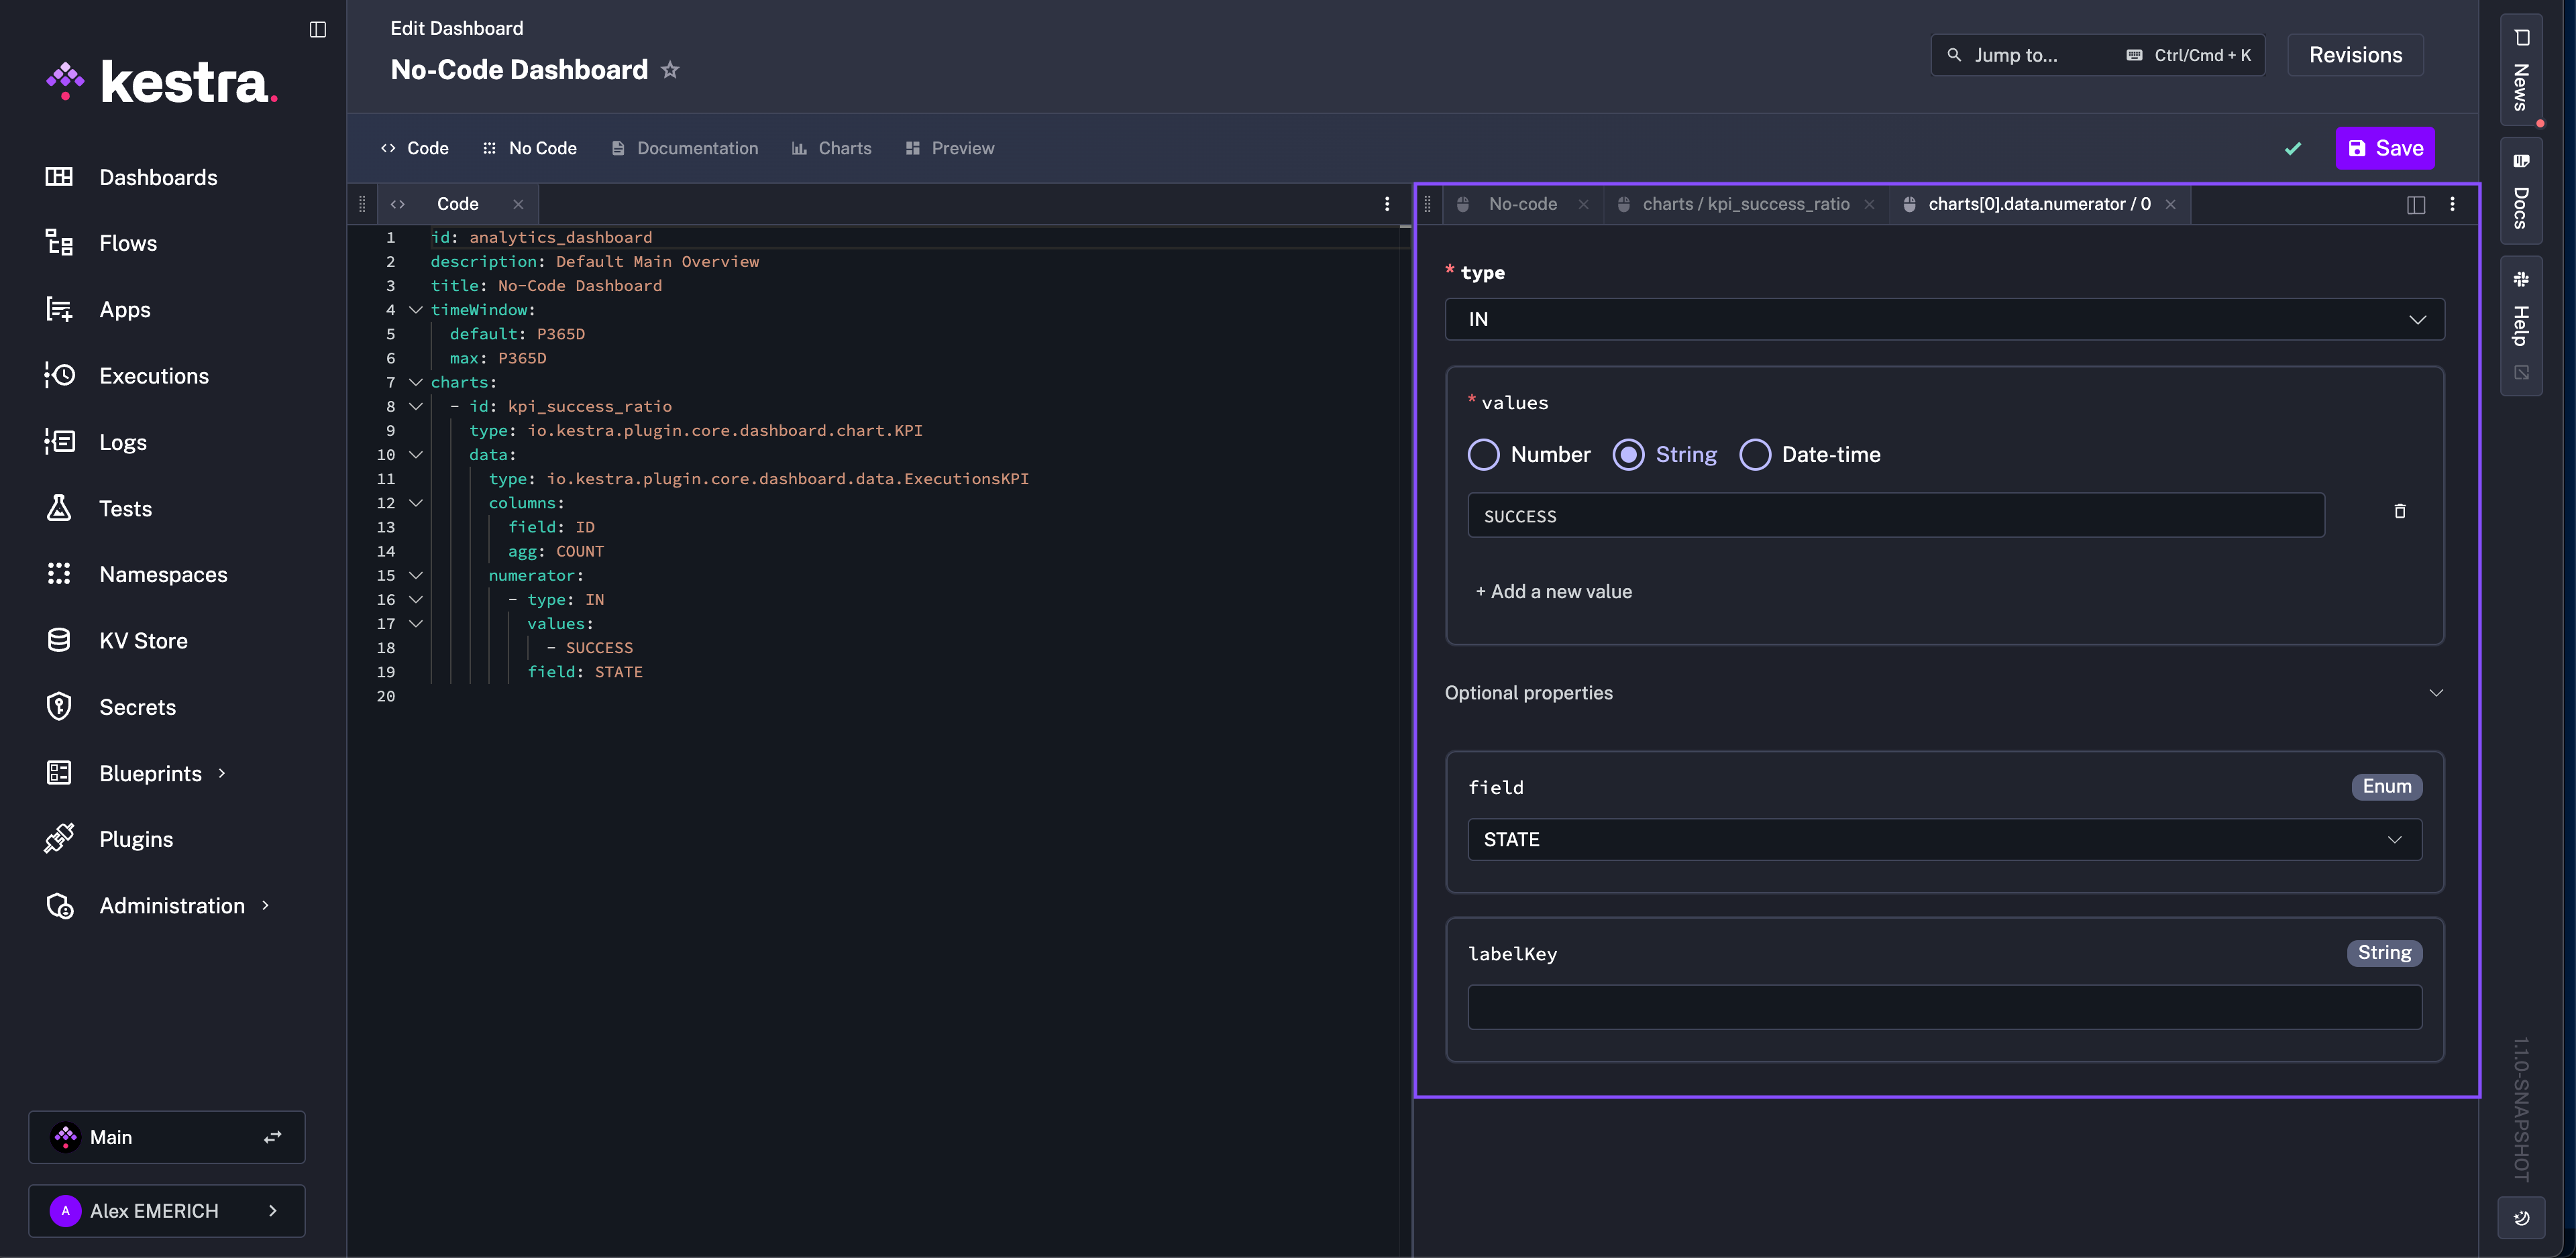
Click + Add under the numerator section to add a filter. Choose IN for type, add SUCCESS as a value, and set field to STATE. This scopes the numerator to successful executions only.
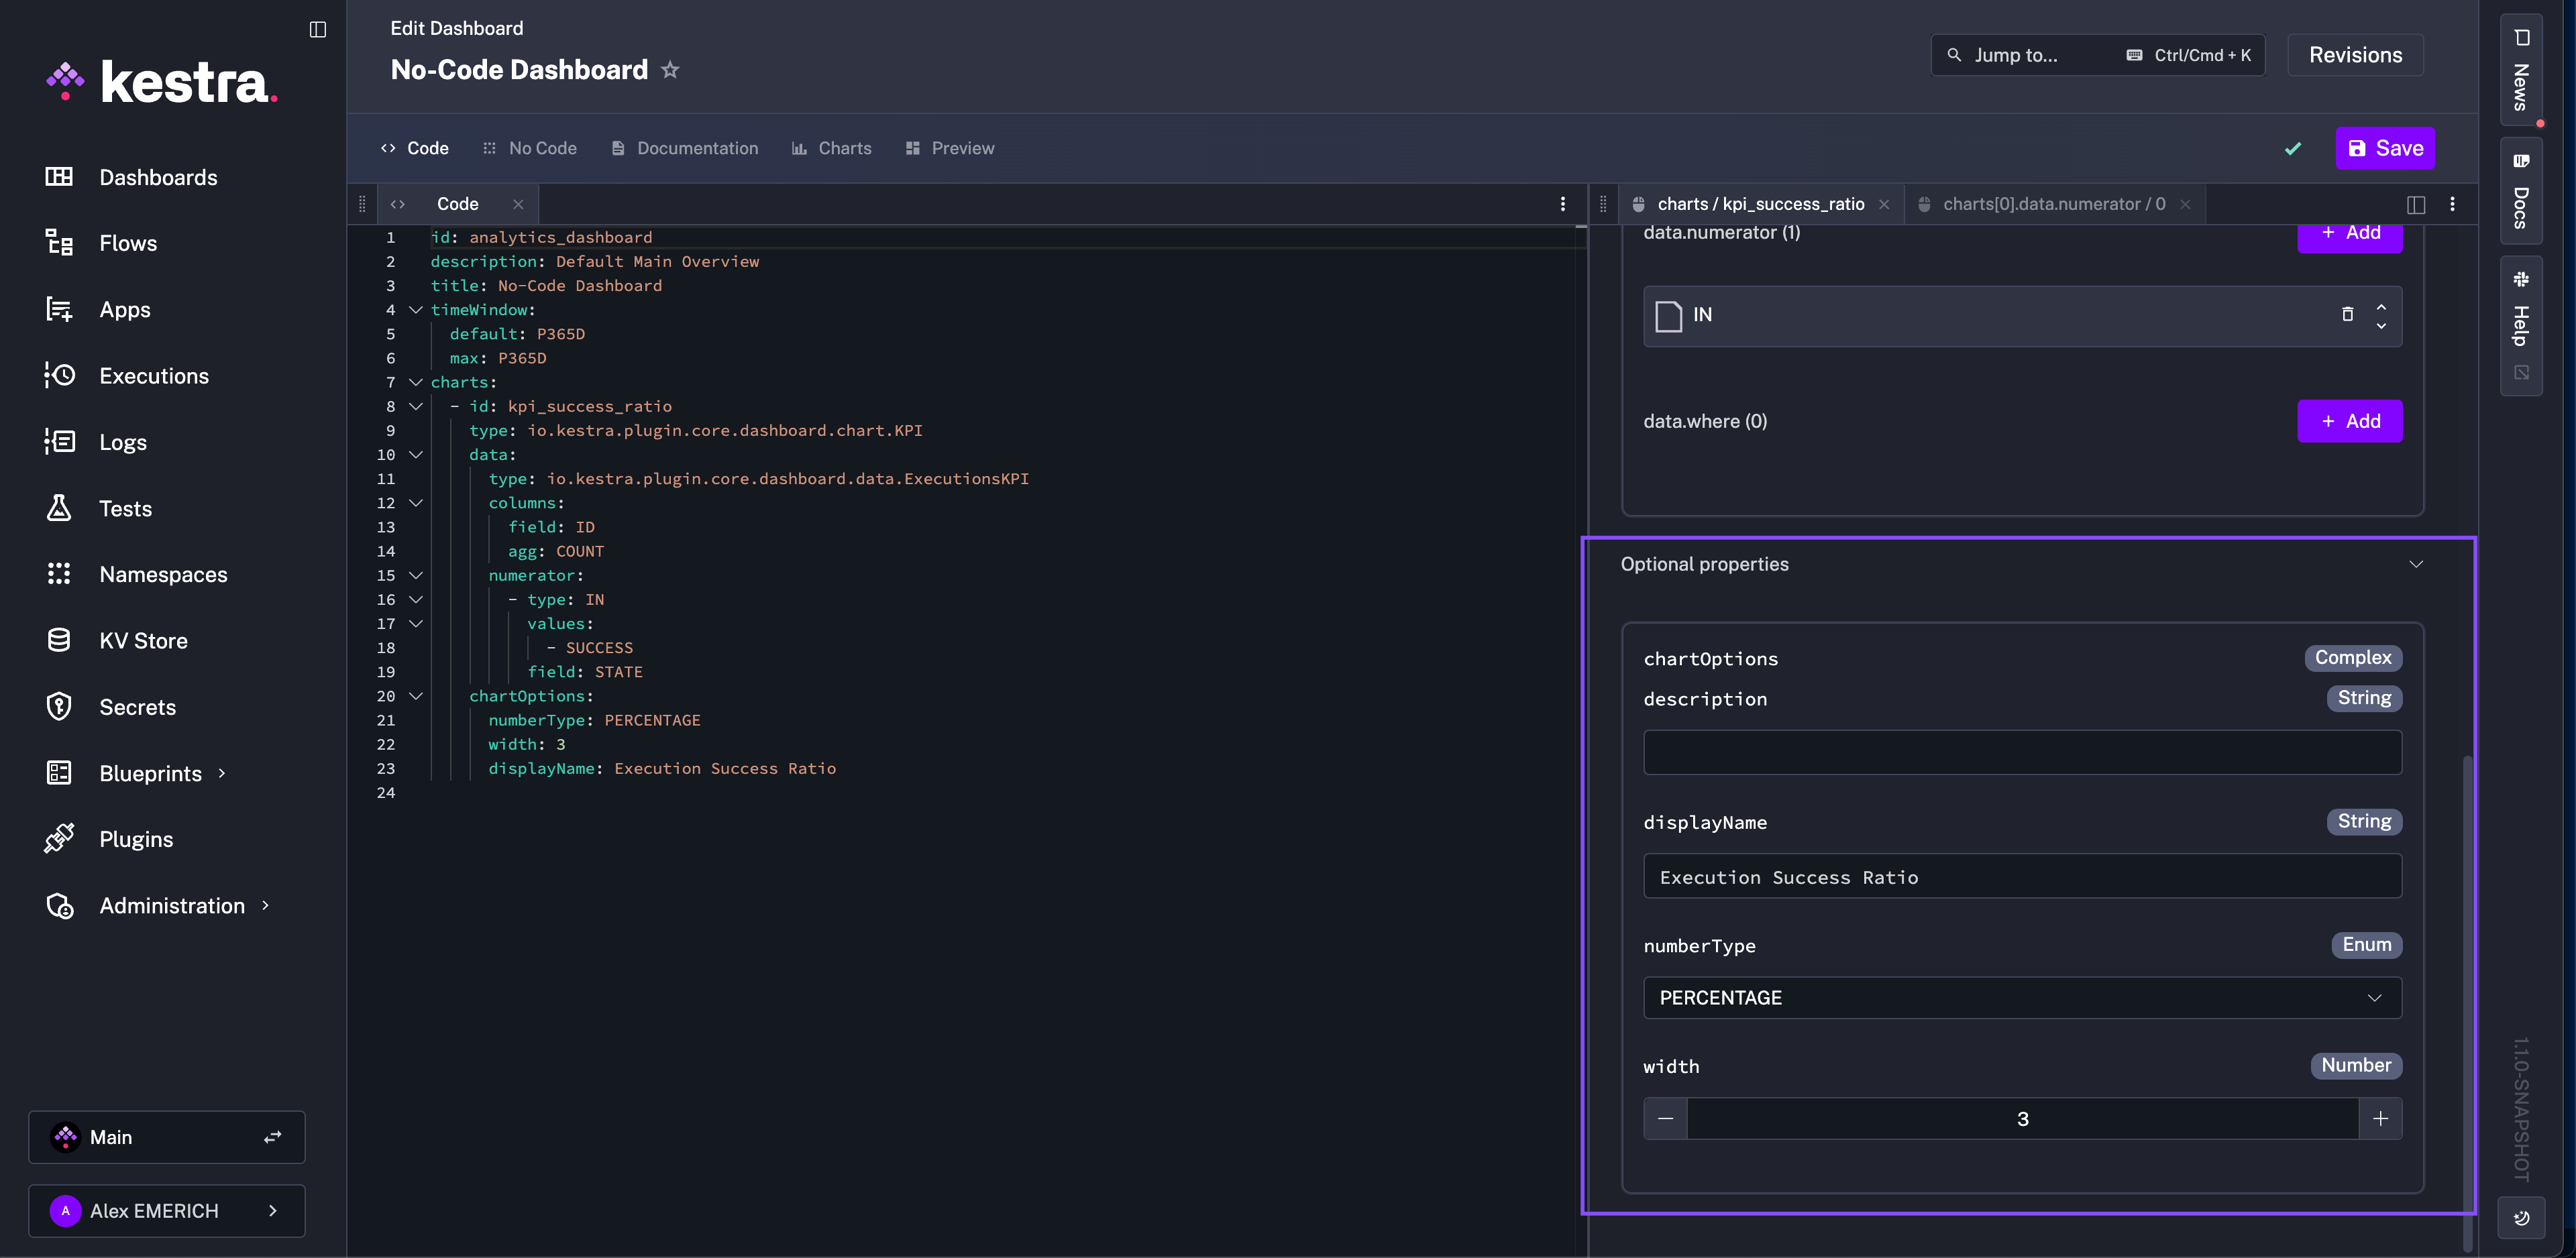
Return to the charts No Code tab and open Optional Properties. Set displayName, change numberType to PERCENTAGE, and set width to 3.
Open the Preview tab to review the chart. Click Save when satisfied. To create a failure ratio chart, copy the generated YAML, paste it into the YAML editor, and replace SUCCESS with FAILED.
Best practices
Organize by purpose. Group related charts into dashboards with a clear goal — for example, separate dashboards for system health, execution performance, and user activity.
Use consistent naming. A pattern like team_metric_type (e.g., dataops_executions_latency) makes dashboards easier to find, version, and export.
Use YAML for reuse. When charts share the same structure with small differences in filters or fields, copy-paste the YAML and modify — faster than rebuilding forms.
Preview before saving. Catch mismatched fields and aggregation errors early before they make it into a published dashboard.
Chart types
Dashboards support six chart types: Bar, Pie, TimeSeries, Table, KPI, and Markdown. Each data chart type is composed of chartOptions and data.
A chart's chartOptions property is where you customize display names and descriptions, and choose whether to add legends and tooltips to complement the visualization. A chart's data property is where you specify which Kestra data to use as a column, how you want the data displayed (e.g., an aggregate count or an ORDER BY), and add any filters you might want applied to the chart (e.g., REGEX match, greater or less than, or not Null).
Each chart's options are listed in the Chart Plugin Documentation where you can dive further into the properties of each type.
Common chart properties
All chart types share the following chartOptions properties:
| Property | Required | Default | Description |
|---|---|---|---|
displayName | Yes | — | The title displayed on the chart |
description | No | — | An optional subtitle or description |
width | No | 6 | Width of the chart on a 12-column grid (1–12) |
Bar chart
type: io.kestra.plugin.core.dashboard.chart.Bar
Compares categorical data across groups. Requires exactly one aggregation column.
Additional chartOptions properties:
| Property | Required | Default | Description |
|---|---|---|---|
column | Yes | — | The data column to use as the x-axis categories |
legend.enabled | No | true | Show or hide the legend |
tooltip | No | ALL | Tooltip display behavior: NONE, ALL, or SINGLE |
yamlcharts:
  - id: executions_per_namespace_bars
    type: io.kestra.plugin.core.dashboard.chart.Bar
    chartOptions:
      displayName: Executions per Namespace
      description: Execution count per namespace
      column: namespace
      legend:
        enabled: true
    data:
      type: io.kestra.plugin.core.dashboard.data.Executions
      columns:
        namespace:
          field: NAMESPACE
        state:
          field: STATE
        total:
          displayName: Executions
          agg: COUNT
Pie chart
type: io.kestra.plugin.core.dashboard.chart.Pie
Shows proportions and distributions. Requires exactly one aggregation column.
Additional chartOptions properties:
| Property | Required | Default | Description |
|---|---|---|---|
graphStyle | No | DONUT | Chart style: PIE or DONUT |
colorByColumn | No | — | The column whose values determine segment colors |
legend.enabled | No | true | Show or hide the legend |
tooltip | No | ALL | Tooltip display behavior: NONE, ALL, or SINGLE |
yamlcharts:
  - id: executions_pie
    type: io.kestra.plugin.core.dashboard.chart.Pie
    chartOptions:
      displayName: Total Executions
      description: Total executions per state
      graphStyle: DONUT
      colorByColumn: state
      legend:
        enabled: true
    data:
      type: io.kestra.plugin.core.dashboard.data.Executions
      columns:
        state:
          field: STATE
        total:
          agg: COUNT
TimeSeries chart
type: io.kestra.plugin.core.dashboard.chart.TimeSeries
Tracks trends over time. Requires between one and two aggregation columns.
Additional chartOptions properties:
| Property | Required | Default | Description |
|---|---|---|---|
column | Yes | — | The data column to use as the time (x) axis |
colorByColumn | No | — | The column whose values determine series colors |
legend.enabled | No | true | Show or hide the legend |
tooltip | No | ALL | Tooltip display behavior: NONE, ALL, or SINGLE |
The graphStyle property can be set per column in data.columns to control how each series is rendered: LINES, BARS, or POINTS. It defaults to LINES when an aggregation is set.
yamlcharts:
  - id: executions_timeseries
    type: io.kestra.plugin.core.dashboard.chart.TimeSeries
    chartOptions:
      displayName: Executions
      description: Executions last week
      column: date
      colorByColumn: state
      legend:
        enabled: true
    data:
      type: io.kestra.plugin.core.dashboard.data.Executions
      columns:
        date:
          field: START_DATE
          displayName: Date
        state:
          field: STATE
        total:
          displayName: Executions
          agg: COUNT
          graphStyle: BARS
        duration:
          displayName: Duration
          field: DURATION
          agg: SUM
          graphStyle: LINES
KPI chart
type: io.kestra.plugin.core.dashboard.chart.KPI
Displays a single key performance indicator value. Requires exactly one aggregation column. Use ExecutionsKPI, FlowsKPI, LogsKPI, or MetricsKPI as the data type for KPI charts.
To display a ratio (e.g., success rate), use the numerator property to filter the subset of rows that count toward the numerator. All rows matching the chart's where clause form the denominator.
Additional chartOptions properties:
| Property | Required | Default | Description |
|---|---|---|---|
numberType | No | FLAT | Display format: FLAT (raw count) or PERCENTAGE |
yamlcharts:
  - id: kpi_success_percentage
    type: io.kestra.plugin.core.dashboard.chart.KPI
    chartOptions:
      displayName: Success Ratio
      numberType: PERCENTAGE
      width: 3
    data:
      type: io.kestra.plugin.core.dashboard.data.ExecutionsKPI
      columns:
        field: FLOW_ID
        agg: COUNT
      numerator:
        - field: STATE
          type: IN
          values:
            - SUCCESS
      where:
        - field: NAMESPACE
          type: EQUAL_TO
          value: "company.team"
Table
type: io.kestra.plugin.core.dashboard.chart.Table
Displays structured data in a sortable, paginated table.
Additional chartOptions properties:
| Property | Required | Default | Description |
|---|---|---|---|
header.enabled | No | true | Show or hide the table header row |
pagination.enabled | No | true | Show or hide table pagination controls |
Column-level properties unique to tables:
| Property | Required | Default | Description |
|---|---|---|---|
columnAlignment | No | LEFT | Text alignment within the column: LEFT, RIGHT, or CENTER |
yamlcharts:
  - id: table_metrics
    type: io.kestra.plugin.core.dashboard.chart.Table
    chartOptions:
      displayName: Sum of sales per namespace
    data:
      type: io.kestra.plugin.core.dashboard.data.Metrics
      columns:
        namespace:
          field: NAMESPACE
        value:
          field: VALUE
          agg: SUM
          columnAlignment: RIGHT
      where:
        - field: NAME
          type: EQUAL_TO
          value: sales_count
      orderBy:
        - column: value
          order: DESC
Markdown
type: io.kestra.plugin.core.dashboard.chart.Markdown
Adds explanatory text or context alongside data charts. No data property is required.
The content of a Markdown chart is set via the source property. Two source types are available:
Text — inline Markdown content:
yamlcharts:
  - id: markdown_insight
    type: io.kestra.plugin.core.dashboard.chart.Markdown
    chartOptions:
      displayName: Chart Insights
      description: How to interpret this chart
    source:
      type: Text
      content: |
        ## Execution Success Rate

        This chart displays the percentage of successful executions over time.

        - A **higher success rate** indicates stable and reliable workflows.
        - Sudden **drops** may signal issues in task execution or external dependencies.
FlowDescription — pulls the description from a specific flow:
yamlcharts:
  - id: markdown_flow_desc
    type: io.kestra.plugin.core.dashboard.chart.Markdown
    chartOptions:
      displayName: Flow Overview
    source:
      type: FlowDescription
      namespace: company.team
      flowId: my_flow
The content shorthand (used in earlier examples) sets plain text content directly. The source property gives you access to the FlowDescription type to pull dynamic content from a flow's description field.
Create a new custom dashboard as code
Clicking on the + Create new dashboard button opens a code editor where you can define the dashboard layout and data sources as code.
The top-level dashboard properties are:
| Property | Description |
|---|---|
title | Dashboard title |
description | Optional description |
timeWindow.default | Default time range, as an ISO 8601 duration (e.g., P7D) |
timeWindow.max | Maximum selectable time range (e.g., P365D) |
charts | List of chart definitions |
Below is an example of a dashboard definition that displays executions over time, flow execution success ratio, a table that uses metrics to display the sum of sales per namespace, a table that shows the log count by level per namespace, and a Markdown insights panel:
Expand for an example dashboard definition
yamltitle: Getting Started
description: First custom dashboard
timeWindow:
  default: P7D
  max: P365D
charts:
  - id: executions_timeseries
    type: io.kestra.plugin.core.dashboard.chart.TimeSeries
    chartOptions:
      displayName: Executions
      description: Executions last week
      legend:
        enabled: true
      column: date
      colorByColumn: state
    data:
      type: io.kestra.plugin.core.dashboard.data.Executions
      columns:
        date:
          field: START_DATE
          displayName: Date
        state:
          field: STATE
        total:
          displayName: Executions
          agg: COUNT
          graphStyle: BARS
        duration:
          displayName: Duration
          field: DURATION
          agg: SUM
          graphStyle: LINES

  - id: kpi_success_percentage
    type: io.kestra.plugin.core.dashboard.chart.KPI
    chartOptions:
      displayName: Success Ratio
      numberType: PERCENTAGE
      width: 3
    data:
      type: io.kestra.plugin.core.dashboard.data.ExecutionsKPI
      columns:
        field: FLOW_ID
        agg: COUNT
      numerator:
        - field: STATE
          type: IN
          values:
            - SUCCESS
      where:
        - field: NAMESPACE
          type: EQUAL_TO
          value: "company.team"

  - id: table_metrics
    type: io.kestra.plugin.core.dashboard.chart.Table
    chartOptions:
      displayName: Sum of sales per namespace
    data:
      type: io.kestra.plugin.core.dashboard.data.Metrics
      columns:
        namespace:
          field: NAMESPACE
        value:
          field: VALUE
          agg: SUM
      where:
        - field: NAME
          type: EQUAL_TO
          value: sales_count
        - field: NAMESPACE
          type: IN
          values:
            - dev_graph
            - prod_graph
      orderBy:
        - column: value
          order: DESC

  - id: table_logs
    type: io.kestra.plugin.core.dashboard.chart.Table
    chartOptions:
      displayName: Log count by level for filtered namespace
    data:
      type: io.kestra.plugin.core.dashboard.data.Logs
      columns:
        level:
          field: LEVEL
        count:
          agg: COUNT
      where:
        - field: NAMESPACE
          type: IN
          values:
            - dev_graph
            - prod_graph

  - id: markdown
    type: io.kestra.plugin.core.dashboard.chart.Markdown
    chartOptions:
      displayName: Chart Insights
      description: How to interpret this chart
    source:
      type: Text
      content: |
        ## Execution Success Rate

        This chart displays the percentage of successful executions over time.

        - A **higher success rate** indicates stable and reliable workflows.
        - Sudden **drops** may signal issues in task execution or external dependencies.
        - Use this insight to identify trends and optimize performance.
To see all available properties to configure a custom dashboard as code, see examples provided in the Enterprise Edition Examples repository.
Exporting data
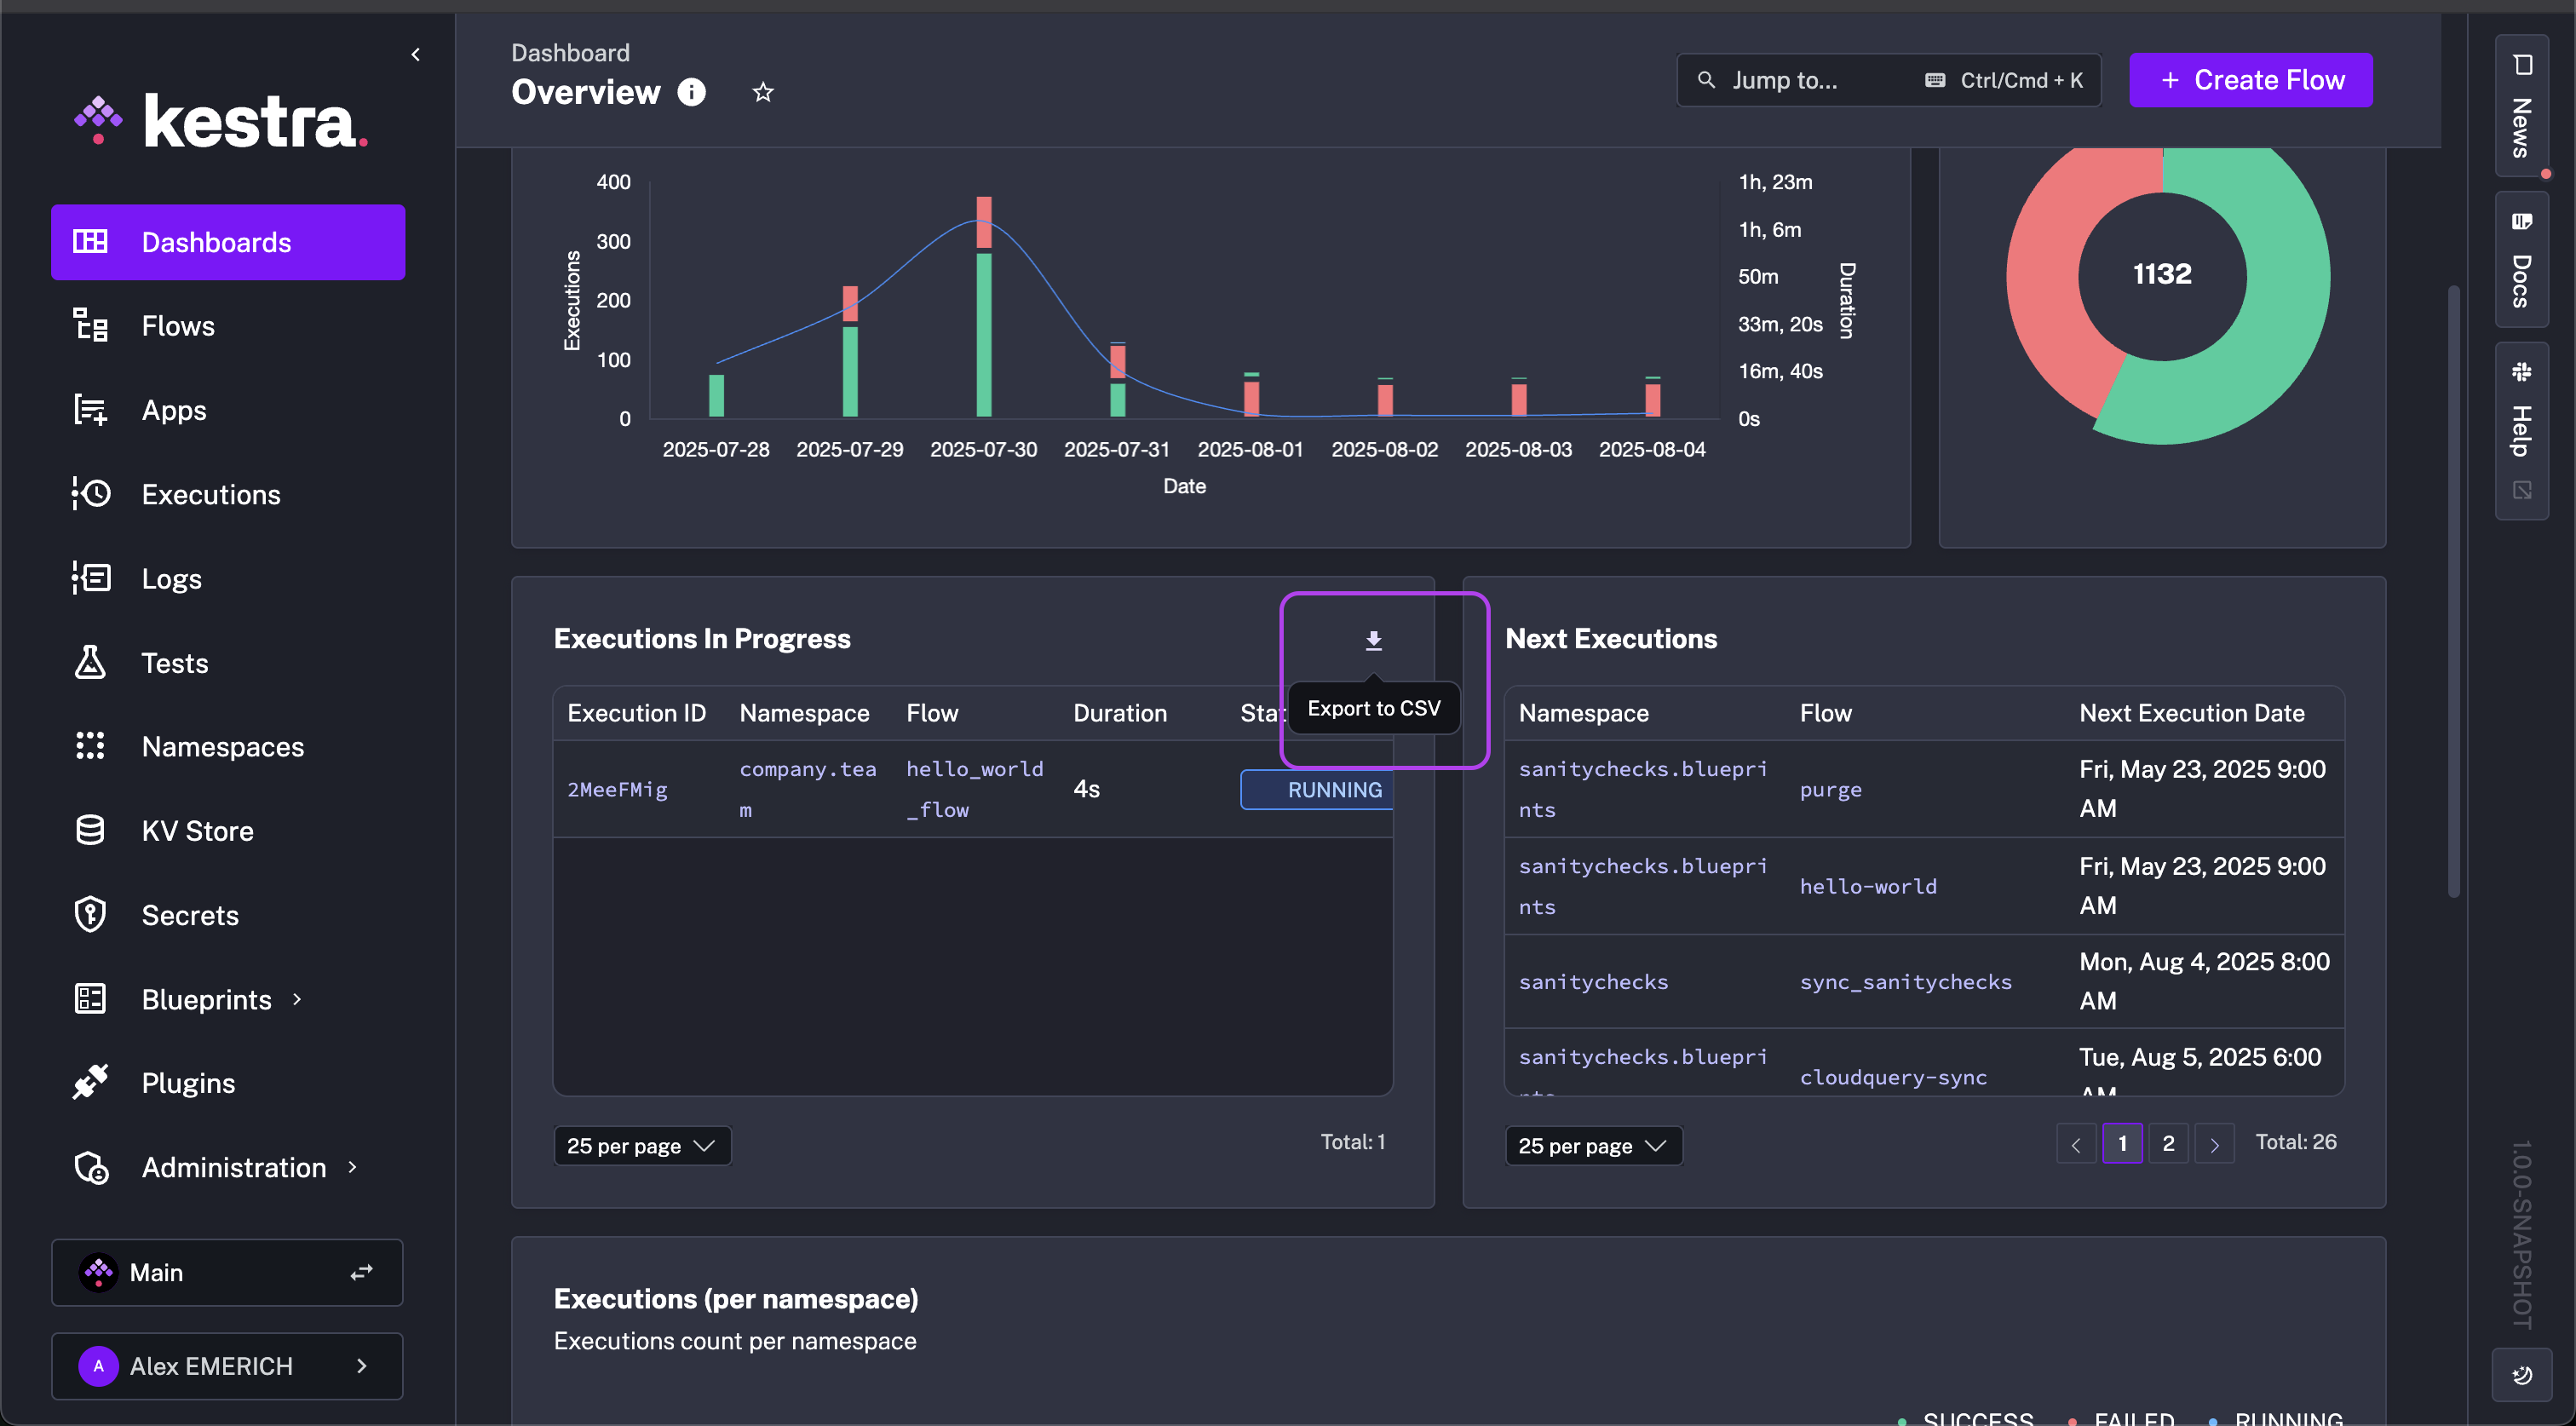
Table data can be exported as a CSV file by hovering over the top-right corner and clicking the download icon. This enables dashboard users to build custom queries in Dashboards and to export data with one click without having to worry about pagination.
Querying data
The data property of a chart defines the type of data that is queried and displayed. The type determines which columns are available.
Data source types
Dashboards can query data from these source types:
| Type | Description |
|---|---|
io.kestra.plugin.core.dashboard.data.Executions | Workflow execution data |
io.kestra.plugin.core.dashboard.data.ExecutionsKPI | Execution data for KPI charts (supports numerator) |
io.kestra.plugin.core.dashboard.data.Flows | Flow definition data |
io.kestra.plugin.core.dashboard.data.FlowsKPI | Flow data for KPI charts (supports numerator) |
io.kestra.plugin.core.dashboard.data.Logs | Log entries produced by your workflows |
io.kestra.plugin.core.dashboard.data.LogsKPI | Log data for KPI charts (supports numerator) |
io.kestra.plugin.core.dashboard.data.Metrics | Metrics emitted by your plugins |
io.kestra.plugin.core.dashboard.data.MetricsKPI | Metrics data for KPI charts (supports numerator) |
io.kestra.plugin.core.dashboard.data.Triggers | Trigger state and scheduling data |
Available fields by data source
After defining the data source, specify the columns to display in the chart. Each column is defined by its field. The fields available depend on the data source type:
Executions / ExecutionsKPI:
| Field | Description |
|---|---|
ID | Execution ID |
NAMESPACE | Namespace of the flow |
FLOW_ID | Flow identifier |
FLOW_REVISION | Flow revision number |
STATE | Execution state (e.g., SUCCESS, FAILED) |
DURATION | Execution duration |
LABELS | Key-value labels attached to the execution |
START_DATE | Execution start timestamp |
END_DATE | Execution end timestamp |
TRIGGER_EXECUTION_ID | ID of the execution that triggered this one |
SCOPE | Execution scope |
Flows / FlowsKPI:
| Field | Description |
|---|---|
ID | Flow identifier |
NAMESPACE | Namespace of the flow |
REVISION | Flow revision number |
Logs / LogsKPI:
| Field | Description |
|---|---|
NAMESPACE | Namespace of the flow |
FLOW_ID | Flow identifier |
EXECUTION_ID | Associated execution ID |
TASK_ID | Task that produced the log |
DATE | Log timestamp |
TASK_RUN_ID | Task run identifier |
ATTEMPT_NUMBER | Task attempt number |
TRIGGER_ID | Trigger identifier |
LEVEL | Log level (e.g., INFO, WARN, ERROR) |
MESSAGE | Log message text (cannot be aggregated) |
Metrics / MetricsKPI:
| Field | Description |
|---|---|
NAMESPACE | Namespace of the flow |
FLOW_ID | Flow identifier |
TASK_ID | Task that emitted the metric |
EXECUTION_ID | Associated execution ID |
TASK_RUN_ID | Task run identifier |
TYPE | Metric type |
NAME | Metric name |
VALUE | Metric value |
DATE | Metric timestamp |
Triggers:
| Field | Description |
|---|---|
ID | Trigger identifier |
NAMESPACE | Namespace of the flow |
FLOW_ID | Flow identifier |
TRIGGER_ID | Trigger identifier within the flow |
EXECUTION_ID | Last execution ID triggered |
NEXT_EXECUTION_DATE | Scheduled next execution date |
WORKER_ID | Worker handling the trigger |
Column properties
Each entry in data.columns supports the following properties:
| Property | Description |
|---|---|
field | The only required property; specifies which field from the data source to use |
displayName | Sets the label displayed in the chart |
agg | Aggregation function: AVG, COUNT, MAX, MIN, or SUM |
graphStyle | Series render style for TimeSeries charts: LINES, BARS, or POINTS (defaults to LINES when agg is set) |
columnAlignment | Column text alignment for Table charts: LEFT, RIGHT, or CENTER |
labelKey | When field: LABELS, filters to a specific label key |
Filtering data
Use the where property to filter the result set before it is displayed. Filters can apply to any field in the data source. Multiple conditions in where are combined with AND by default. To use OR logic, set type: OR on a condition.
Available filter types:
CONTAINSENDS_WITHEQUAL_TOGREATER_THANGREATER_THAN_OR_EQUAL_TOINIS_FALSEIS_NOT_NULLIS_NULLIS_TRUELESS_THANLESS_THAN_OR_EQUAL_TONOT_EQUAL_TONOT_INORREGEXSTARTS_WITH