 Alerting & Monitoring
Here are some best practices for alerting and monitoring your Kestra instance.
Alerting
Failure alerts are non-negotiable. When a production workflow fails, you should get notified about it as soon as possible. To implement failure alerting, you can leverage Kestra's built in notification tasks, including:
Technically, you can add custom failure alerts to each flow separately using the errors tasks:
id: onFailureAlert
namespace: company.team

tasks:
  - id: fail
    type: io.kestra.plugin.scripts.shell.Commands
    taskRunner:
      type: io.kestra.plugin.core.runner.Process
    commands:
      - exit 1

errors:
  - id: slack
    type: io.kestra.plugin.notifications.slack.SlackIncomingWebhook
    url: "{{ secret('SLACK_WEBHOOK') }}"
    payload: |
      {
        "channel": "#alerts",
        "text": "Failure alert for flow {{ flow.namespace }}.{{ flow.id }} with ID {{ execution.id }}"
      }
However, this can lead to some boilerplate code if you start copy-pasting this errors configuration to multiple flows.
To implement a centralized namespace-level alerting, we instead recommend a dedicated monitoring workflow with a notification task and a Flow trigger. Below is an example workflow that automatically sends a Slack alert as soon as any flow in a namespace company.analytics fails or finishes with warnings.
id: failureAlertToSlack
namespace: company.monitoring

tasks:
  - id: send
    type: io.kestra.plugin.notifications.slack.SlackExecution
    url: "{{ secret('SLACK_WEBHOOK') }}"
    channel: "#general"
    executionId: "{{trigger.executionId}}"

triggers:
  - id: listen
    type: io.kestra.plugin.core.trigger.Flow
    conditions:
      - type: io.kestra.plugin.core.condition.ExecutionStatusCondition
        in:
          - FAILED
          - WARNING
      - type: io.kestra.plugin.core.condition.ExecutionNamespaceCondition
        namespace: company.analytics
        prefix: true
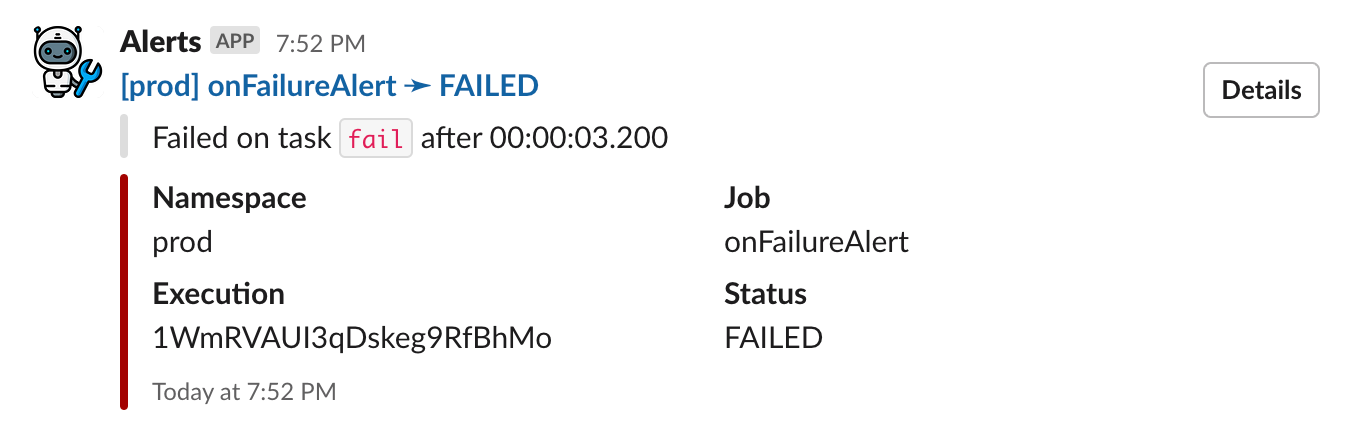
Adding this single flow will ensure that you receive a Slack alert on any flow failure in the company.analytics namespace. Here is an example alert notification:
Note that if you want this alert to be sent on failure across multiple namespaces, you will need to add an OrCondition to the conditions list. See the example below:
id: alert
namespace: company.system

tasks:
  - id: send
    type: io.kestra.plugin.notifications.slack.SlackExecution
    url: "{{ secret('SLACK_WEBHOOK') }}"
    channel: "#general"
    executionId: "{{trigger.executionId}}"

triggers:
  - id: listen
    type: io.kestra.plugin.core.trigger.Flow
    conditions:
      - type: io.kestra.plugin.core.condition.ExecutionStatusCondition
        in:
          - FAILED
          - WARNING
      - type: io.kestra.plugin.core.condition.OrCondition
        conditions:
          - type: io.kestra.plugin.core.condition.ExecutionNamespaceCondition
            namespace: company.product
            prefix: true
          - type: io.kestra.plugin.core.condition.ExecutionFlowCondition
            flowId: cleanup
            namespace: company.system
The example above is correct. However, if you instead list the conditions without the OrCondition, no alerts would be sent as kestra would try to match all criteria and there would be no overlap between the two conditions (they would cancel each other out). See the example below:
id: bad_example
namespace: company.monitoring
description: This example will not work

tasks:
  - id: send
    type: io.kestra.plugin.notifications.slack.SlackExecution
    url: "{{ secret('SLACK_WEBHOOK') }}"
    channel: "#general"
    executionId: "{{trigger.executionId}}"

triggers:
  - id: listen
    type: io.kestra.plugin.core.trigger.Flow
    conditions:
      - type: io.kestra.plugin.core.condition.ExecutionStatusCondition
        in:
          - FAILED
          - WARNING
      - type: io.kestra.plugin.core.condition.ExecutionNamespaceCondition
        namespace: company.product
        prefix: true
      - type: io.kestra.plugin.core.condition.ExecutionFlowCondition
        flowId: cleanup
        namespace: company.system
Here, there's no overlap between the two conditions. The first condition will only match executions in the company.product namespace, while the second condition will only match executions from the cleanup flow in the company.system namespace. If you want to match executions from the cleanup flow in the company.system namespace or any execution in the product namespace, make sure to add the OrCondition.
Monitoring
By default, Kestra exposes a monitoring endpoint on port 8081. You can change this port using the endpoints.all.port property in the configuration options.
This monitoring endpoint provides invaluable information for troubleshooting and monitoring, including Prometheus metrics and several Kestra's internal routes. For instance, the /health endpoint exposed by default on port 8081 (e.g. http://localhost:8081/health) generates a similar response as shown below as long as your Kestra instance is healthy:
{
  "name": "kestra",
  "status": "UP",
  "details": {
    "jdbc": {
      "name": "kestra",
      "status": "UP",
      "details": {
        "jdbc:postgresql://postgres:5432/kestra": {
          "name": "kestra",
          "status": "UP",
          "details": {
            "database": "PostgreSQL",
            "version": "15.3 (Debian 15.3-1.pgdg110+1)"
          }
        }
      }
    },
    "compositeDiscoveryClient()": {
      "name": "kestra",
      "status": "UP",
      "details": {
        "services": {

        }
      }
    },
    "service": {
      "name": "kestra",
      "status": "UP"
    },
    "diskSpace": {
      "name": "kestra",
      "status": "UP",
      "details": {
        "total": 204403494912,
        "free": 13187035136,
        "threshold": 10485760
      }
    }
  }
}
Prometheus
Kestra exposes Prometheus metrics on the endpoint /prometheus. This endpoint can be used by any compatible monitoring system.
Kestra's metrics
You can leverage Kestra's internal metrics to configure custom alerts. Each metric provides multiple time series with tags allowing to track at least namespace & flow but also other tags depending on available tasks.
Kestra metrics use the prefix kestra. This prefix can be changed using the kestra.metrics.prefix property in the configuration options.
Each task type can expose custom metrics that will be also exposed on Prometheus.
Worker
| Metrics | Type | Description |
|---|---|---|
| worker.running.count | GAUGE | Count of tasks actually running |
| worker.started.count | COUNTER | Count of tasks started |
| worker.retried.count | COUNTER | Count of tasks retried |
| worker.ended.count | COUNTER | Count of tasks ended |
| worker.ended.duration | TIMER | Duration of tasks ended |
Executor
| Metrics | Type | Description |
|---|---|---|
| executor.taskrun.next.count | COUNTER | Count of tasks found |
| executor.taskrun.ended.count | COUNTER | Count of tasks ended |
| executor.taskrun.ended.duration | TIMER | Duration of tasks ended |
| executor.workertaskresult.count | COUNTER | Count of task results sent by a worker |
| executor.execution.started.count | COUNTER | Count of executions started |
| executor.execution.end.count | COUNTER | Count of executions ended |
| executor.execution.duration | TIMER | Duration of executions ended |
Indexer
| Metrics | Type | Description |
|---|---|---|
| indexer.count | COUNTER | Count of index requests sent to a repository |
| indexer.duration | DURATION | Duration of index requests sent to a repository |
Scheduler
| Metrics | Type | Description |
|---|---|---|
| scheduler.trigger.count | COUNTER | Count of triggers |
| scheduler.evaluate.running.count | COUNTER | Evaluation of triggers actually running |
| scheduler.evaluate.duration | TIMER | Duration of trigger evaluation |
Others metrics
Kestra also exposes all internal metrics from the following sources:
Check out the Micronaut documentation for more information.
Grafana and Kibana
Kestra uses Elasticsearch to store all executions and metrics. Therefore, you can easily create a dashboard with Grafana or Kibana to monitor the health of your Kestra instance.
We'd love to see what dashboards you will build. Feel free to share a screenshot or a template of your dashboard with the community.
Kestra endpoints
Kestra exposes internal endpoints on the management port (8081 by default) to provide status corresponding to the server type:
/worker: will expose all currently running tasks on this worker./scheduler: will expose all currently scheduled flows on this scheduler with the next date./kafkastreams: will expose all Kafka Streams states and aggregated store lag./kafkastreams/{clientId}/lag: will expose details lag for aclientId./kafkastreams/{clientId}/metrics: will expose details metrics for aclientId.
Other Micronaut default endpoints
Since Kestra is based on Micronaut, the default Micronaut endpoints are enabled by default on port 8081:
/infoInfo Endpoint with git status information./healthHealth Endpoint usable as an external heathcheck for the application./loggersLoggers Endpoint allows changing logger level at runtime./metricsMetrics Endpoint metrics in JSON format./envEnvironment Endpoint to debug configuration files.
You can disable some endpoints following the above Micronaut configuration.
Debugging techniques
Without any order, here are debugging techniques that administrators can use to understand their issues:
Enable verbose log
Kestra had some management endpoints including one that allows changing logging verbosity at run time.
Inside the container (or in local if standalone jar is used), send this command to enable very verbose logging:
curl -i -X POST -H "Content-Type: application/json" \
  -d '{ "configuredLevel": "TRACE" }' \
  http://localhost:8081/loggers/io.kestra
Alternatively, you can change logging levels on configuration files:
logger:
  levels:
    io.kestra.core.runners: TRACE
Take a thread dump
You can request a thread dump via the /threaddump endpoint available on the management port (8081 if not configured otherwise).
Was this page helpful?