Use Ansible Playbooks to Check Resources and Automate Updates
For the complete documentation index, see llms.txt. For a full content snapshot, see llms-full.txt. Append.mdto anykestra.io/docs/*URL for plain Markdown.
Run Ansible playbooks from Kestra and coordinate downstream infrastructure tasks.
Ansible is an agentless automation tool that uses YAML playbooks to describe desired state and apply it over SSH or APIs. Teams rely on it to install software, manage configs, update systems, and provision cloud infrastructure.
System report playbook (cross-platform)
This playbook audits a host without assuming the OS, captures diagnostics, and upgrades python3 when needed using the appropriate package manager (apt, yum, or Homebrew). It writes a JSON report to ./system_info.json. You can extend the same pattern to a real-world fleet by adding an inventory of servers or laptops, running over SSH instead of localhost, and inserting more version/presence checks for tools your team depends on (e.g., node, aws, kubectl). In multi-machine mode, facts and JSON outputs can be aggregated centrally to spot drift and trigger remediations.
View the playbook
---- name: Collect and report system information (system agnostic)  hosts: localhost  connection: local  gather_facts: true
  vars:    system_info_output: "./system_info.json"    python3_min_version: "3.11.0"
  tasks:    - name: Show basic system summary      ansible.builtin.debug:        msg:          - "Hostname: {{ ansible_facts['hostname'] | default('unknown') }}"          - "OS family: {{ ansible_facts['os_family'] | default('unknown') }}"          - "Distribution: {{ ansible_facts['distribution'] | default('') }} {{ ansible_facts['distribution_version'] | default('') }}"          - "Kernel: {{ ansible_facts['kernel'] | default('unknown') }}"          - "Architecture: {{ ansible_facts['architecture'] | default('unknown') }}"          - "CPU(s): {{ ansible_facts['processor_vcpus'] | default('unknown') }}"          - "Total RAM (MB): {{ ansible_facts['memtotal_mb'] | default('unknown') }}"          - "Primary IP: {{ ansible_facts['default_ipv4']['address'] | default('unknown') }}"
    # -----------------------------    # Extra checks / diagnostics    # -----------------------------
    - name: Check overall disk usage (df -h)      ansible.builtin.command: df -h      register: disk_usage      changed_when: false      failed_when: false   # in case df is not available
    - name: Check load average and uptime      ansible.builtin.command: uptime      register: uptime_cmd      changed_when: false      failed_when: false
    - name: Show top 5 memory-hungry processes      ansible.builtin.shell: |        ps aux | head -n 1        ps aux | sort -nrk 4 | head -n 5      register: top_mem_processes      changed_when: false      failed_when: false
    # -----------------------------    # Python3 detection & version    # -----------------------------
    - name: Check if python3 is installed      ansible.builtin.command: python3 --version      register: python3_check      failed_when: false      changed_when: false
    - name: Parse python3 version      ansible.builtin.set_fact:        python3_installed: "{{ python3_check.rc == 0 }}"        python3_version: >-          {{            (python3_check.stdout.split()[1])            if (python3_check.rc == 0 and (python3_check.stdout | length > 0))            else 'unknown'          }}
    - name: Debug python3 detection      ansible.builtin.debug:        msg:          - "python3 installed: {{ python3_installed }}"          - "python3 version: {{ python3_version }}"
    # -----------------------------    # OS family convenience flags    # -----------------------------
    - name: Set OS family flags      ansible.builtin.set_fact:        os_family: "{{ ansible_facts['os_family'] | default('Unknown') }}"        is_debian: "{{ ansible_facts['os_family'] == 'Debian' }}"        is_redhat: "{{ ansible_facts['os_family'] == 'RedHat' }}"        is_darwin: "{{ ansible_facts['os_family'] == 'Darwin' }}"
    # -----------------------------    # Decide if python3 upgrade is needed    # -----------------------------
    - name: Decide if python3 upgrade is needed      ansible.builtin.set_fact:        python3_needs_upgrade: >-          {{            python3_installed            and python3_version != 'unknown'            and (python3_version is version(python3_min_version, '<'))          }}
    - name: Debug python3 upgrade decision      ansible.builtin.debug:        msg:          - "Minimum required python3 version: {{ python3_min_version }}"          - "Current python3 version: {{ python3_version }}"          - "Needs upgrade: {{ python3_needs_upgrade }}"
    - name: Initialize python3 upgrade result      ansible.builtin.set_fact:        python3_upgrade_result:          manager: "none"          attempted: false          note: "No upgrade attempted yet."
    # -----------------------------    # Debian / Ubuntu path (apt)    # -----------------------------
    - name: Upgrade python3 via apt if needed (Debian family)      ansible.builtin.apt:        name: python3        state: latest        update_cache: yes      when:        - is_debian        - python3_needs_upgrade      register: python3_upgrade_apt
    - name: Record python3 upgrade result for Debian family      ansible.builtin.set_fact:        python3_upgrade_result: >-          {{            python3_upgrade_result | combine(              {                'manager': 'apt',                'attempted': python3_needs_upgrade,                'note': (                  python3_needs_upgrade                  | ternary(                      'python3 upgrade handled by apt on Debian-based system (see play output).',                      'python3 already meets minimum version; apt upgrade not required.'                    )                )              },              recursive=True            )          }}      when: is_debian
    # -----------------------------    # RedHat / CentOS / Fedora path (yum)    # -----------------------------
    - name: Upgrade python3 via yum if needed (RedHat family)      ansible.builtin.yum:        name: python3        state: latest      when:        - is_redhat        - python3_needs_upgrade      register: python3_upgrade_yum
    - name: Record python3 upgrade result for RedHat family      ansible.builtin.set_fact:        python3_upgrade_result: >-          {{            python3_upgrade_result | combine(              {                'manager': 'yum',                'attempted': python3_needs_upgrade,                'note': (                  python3_needs_upgrade                  | ternary(                      'python3 upgrade handled by yum on RedHat-based system (see play output).',                      'python3 already meets minimum version; yum upgrade not required.'                    )                )              },              recursive=True            )          }}      when: is_redhat
    # -----------------------------    # macOS path (Homebrew)    # -----------------------------
    - name: Check if Homebrew is installed (macOS)      ansible.builtin.command: brew --version      register: brew_check      failed_when: false      changed_when: false      when: is_darwin
    - name: Upgrade python via Homebrew if needed (macOS)      ansible.builtin.command: brew upgrade python      when:        - is_darwin        - python3_needs_upgrade        - brew_check.rc == 0      register: python3_upgrade_brew      changed_when: true
    - name: Record python3 upgrade result for macOS      ansible.builtin.set_fact:        python3_upgrade_result: >-          {{            python3_upgrade_result | combine(              {                'manager': (brew_check.rc == 0) | ternary('brew', 'none'),                'attempted': (python3_needs_upgrade and brew_check.rc == 0),                'note': (                  (not python3_needs_upgrade)                  | ternary(                      'python3 already meets minimum version; brew upgrade not required.',                      (                        brew_check.rc == 0                        | ternary(                            'python upgrade handled by Homebrew on macOS (see play output).',                            'Homebrew not available; cannot upgrade python on macOS.'                          )                      )                    )                )              },              recursive=True            )          }}      when: is_darwin
    # -----------------------------    # Build & write combined report    # -----------------------------
    - name: Build combined system info structure      ansible.builtin.set_fact:        full_system_info:          collected_at: "{{ ansible_facts['date_time']['iso8601'] | default('') }}"          hostname: "{{ ansible_facts['hostname'] | default('') }}"          os:            family: "{{ ansible_facts['os_family'] | default('') }}"            distribution: "{{ ansible_facts['distribution'] | default('') }}"            version: "{{ ansible_facts['distribution_version'] | default('') }}"            release: "{{ ansible_facts['distribution_release'] | default('') }}"            kernel: "{{ ansible_facts['kernel'] | default('') }}"          hardware:            architecture: "{{ ansible_facts['architecture'] | default('') }}"            cpu_model: "{{ ansible_facts['processor'][1] | default('') if ansible_facts.get('processor') else '' }}"            vcpus: "{{ ansible_facts['processor_vcpus'] | default(0) }}"            memtotal_mb: "{{ ansible_facts['memtotal_mb'] | default(0) }}"          network:            default_ipv4: "{{ ansible_facts['default_ipv4'] | default({}) }}"            all_ipv4: "{{ ansible_facts['all_ipv4_addresses'] | default([]) }}"            interfaces: "{{ ansible_facts['interfaces'] | default([]) }}"          storage:            mounts: "{{ ansible_facts['mounts'] | default([]) }}"          virtualization:            type: "{{ ansible_facts['virtualization_type'] | default('') }}"            role: "{{ ansible_facts['virtualization_role'] | default('') }}"          diagnostics:            disk_usage: "{{ disk_usage.stdout | default('') }}"            uptime: "{{ uptime_cmd.stdout | default('') }}"            top_mem_processes: "{{ top_mem_processes.stdout | default('') }}"          python3:            installed: "{{ python3_installed }}"            version: "{{ python3_version }}"            minimum_required: "{{ python3_min_version }}"            needs_upgrade: "{{ python3_needs_upgrade }}"            upgrade: "{{ python3_upgrade_result }}"          ansible_facts: "{{ ansible_facts }}"
    - name: Write full system info to JSON file      ansible.builtin.copy:        dest: "{{ system_info_output }}"        content: "{{ full_system_info | to_nice_json }}"        mode: "0600"
- name: Print location of saved system info ansible.builtin.debug: msg: - "Full system information written to: {{ system_info_output }}" - "You can inspect it with: jq '.' {{ system_info_output }} (if jq is installed)"What this playbook covers
It gathers the usual suspects (OS family, distro, kernel, CPU, RAM, IP), then pulls quick diagnostics like disk usage, uptime, and top memory processes. It checks python3 and, if it’s older than 3.11.0, upgrades it with the right package manager depending on the OS of the machine (apt, yum, or Homebrew).
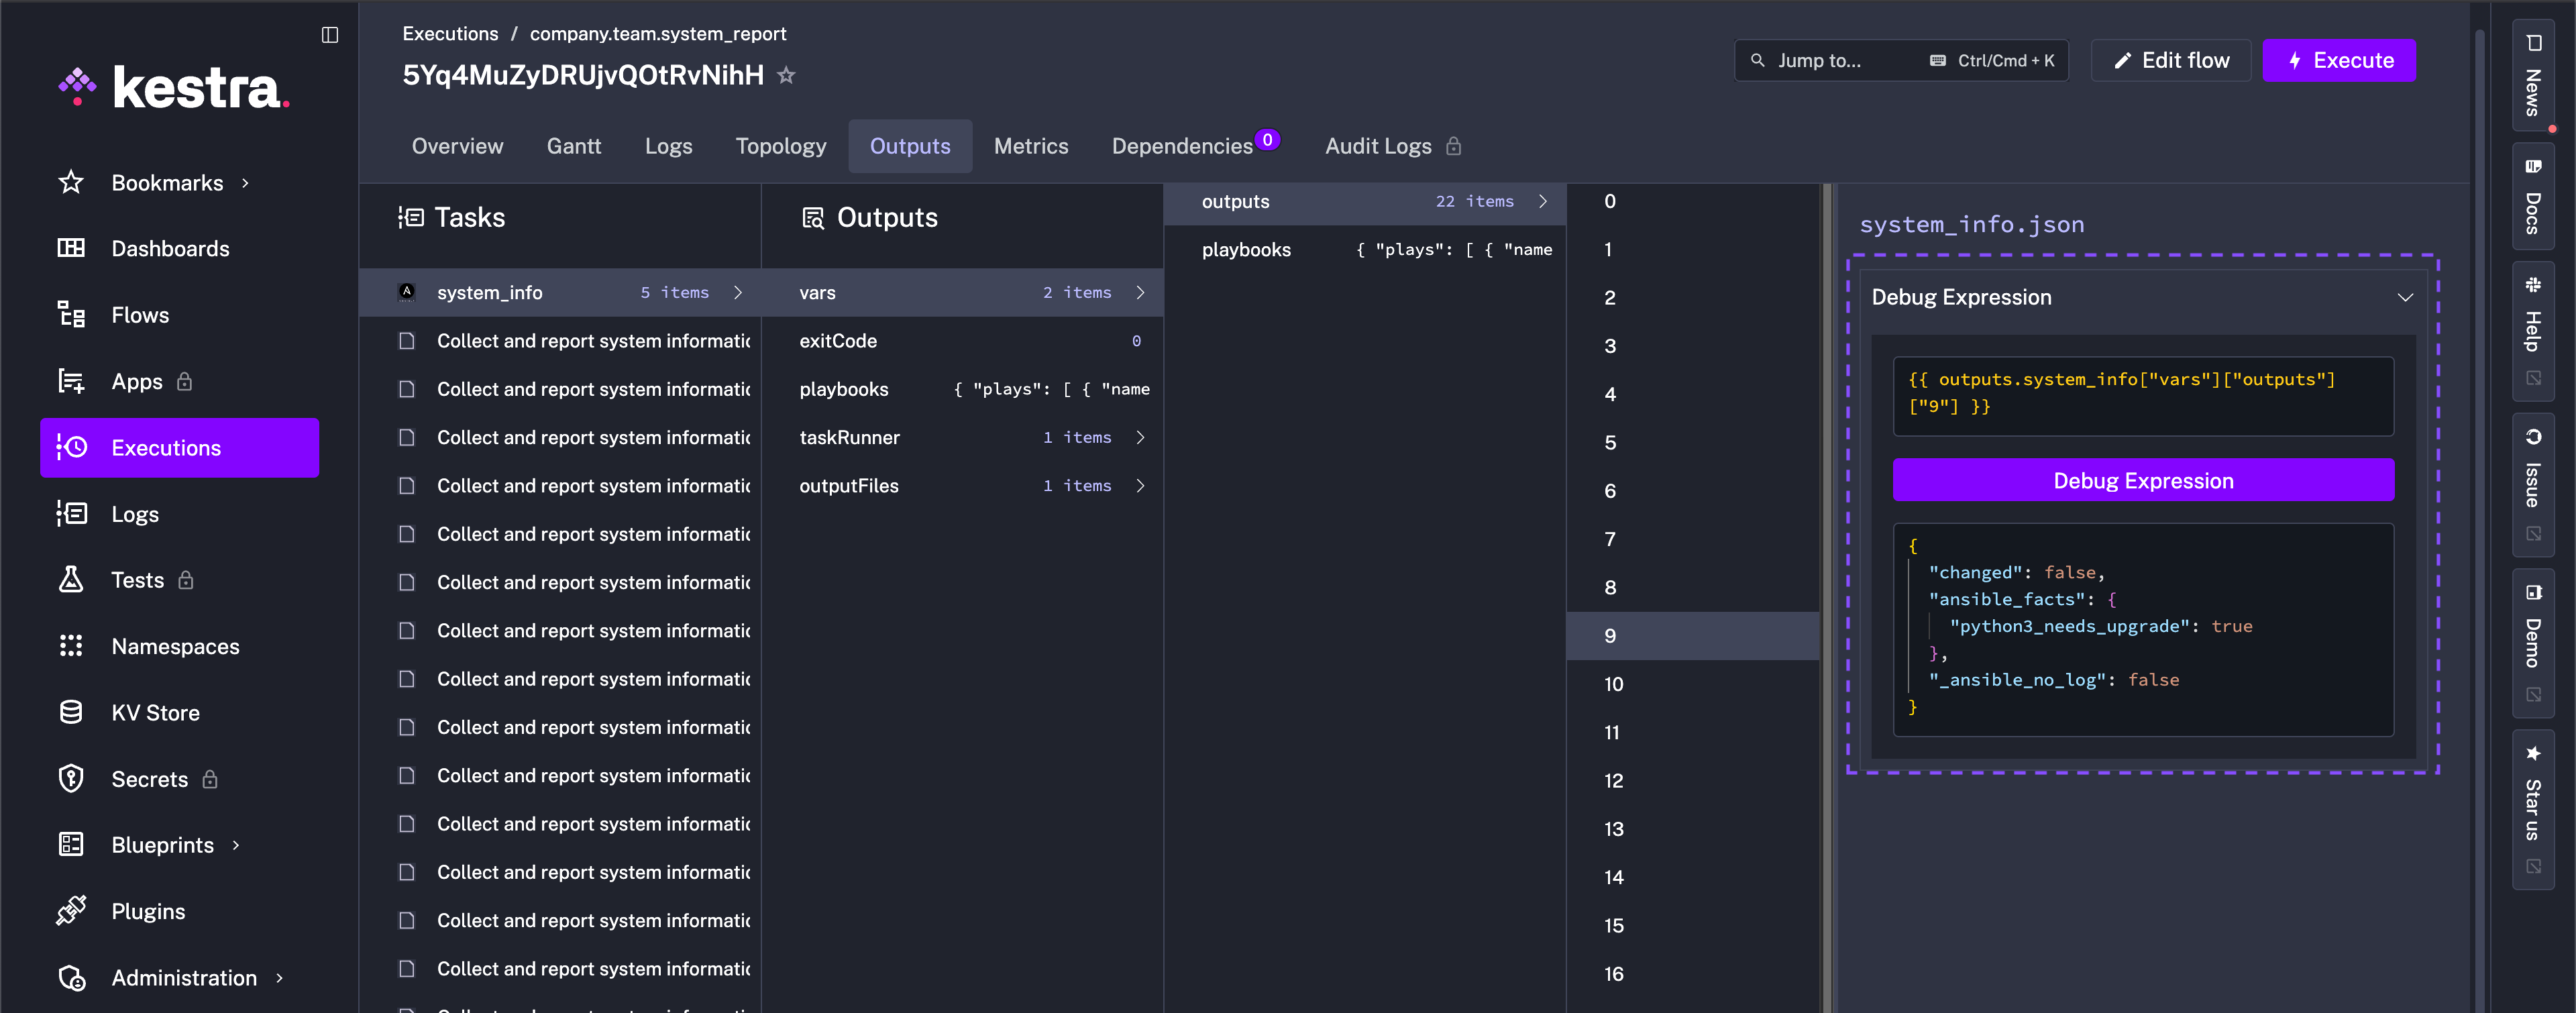
Each play in the playbook generates a log and output, for example, there is a log for each diagnostic metric check, a log for Python3 detection and version, and a log for building and writing the combined report to name a few.
The image below shows an example output targeting a local machine where python3 is installed (python3_installed), but the Python version is "3.10.4".
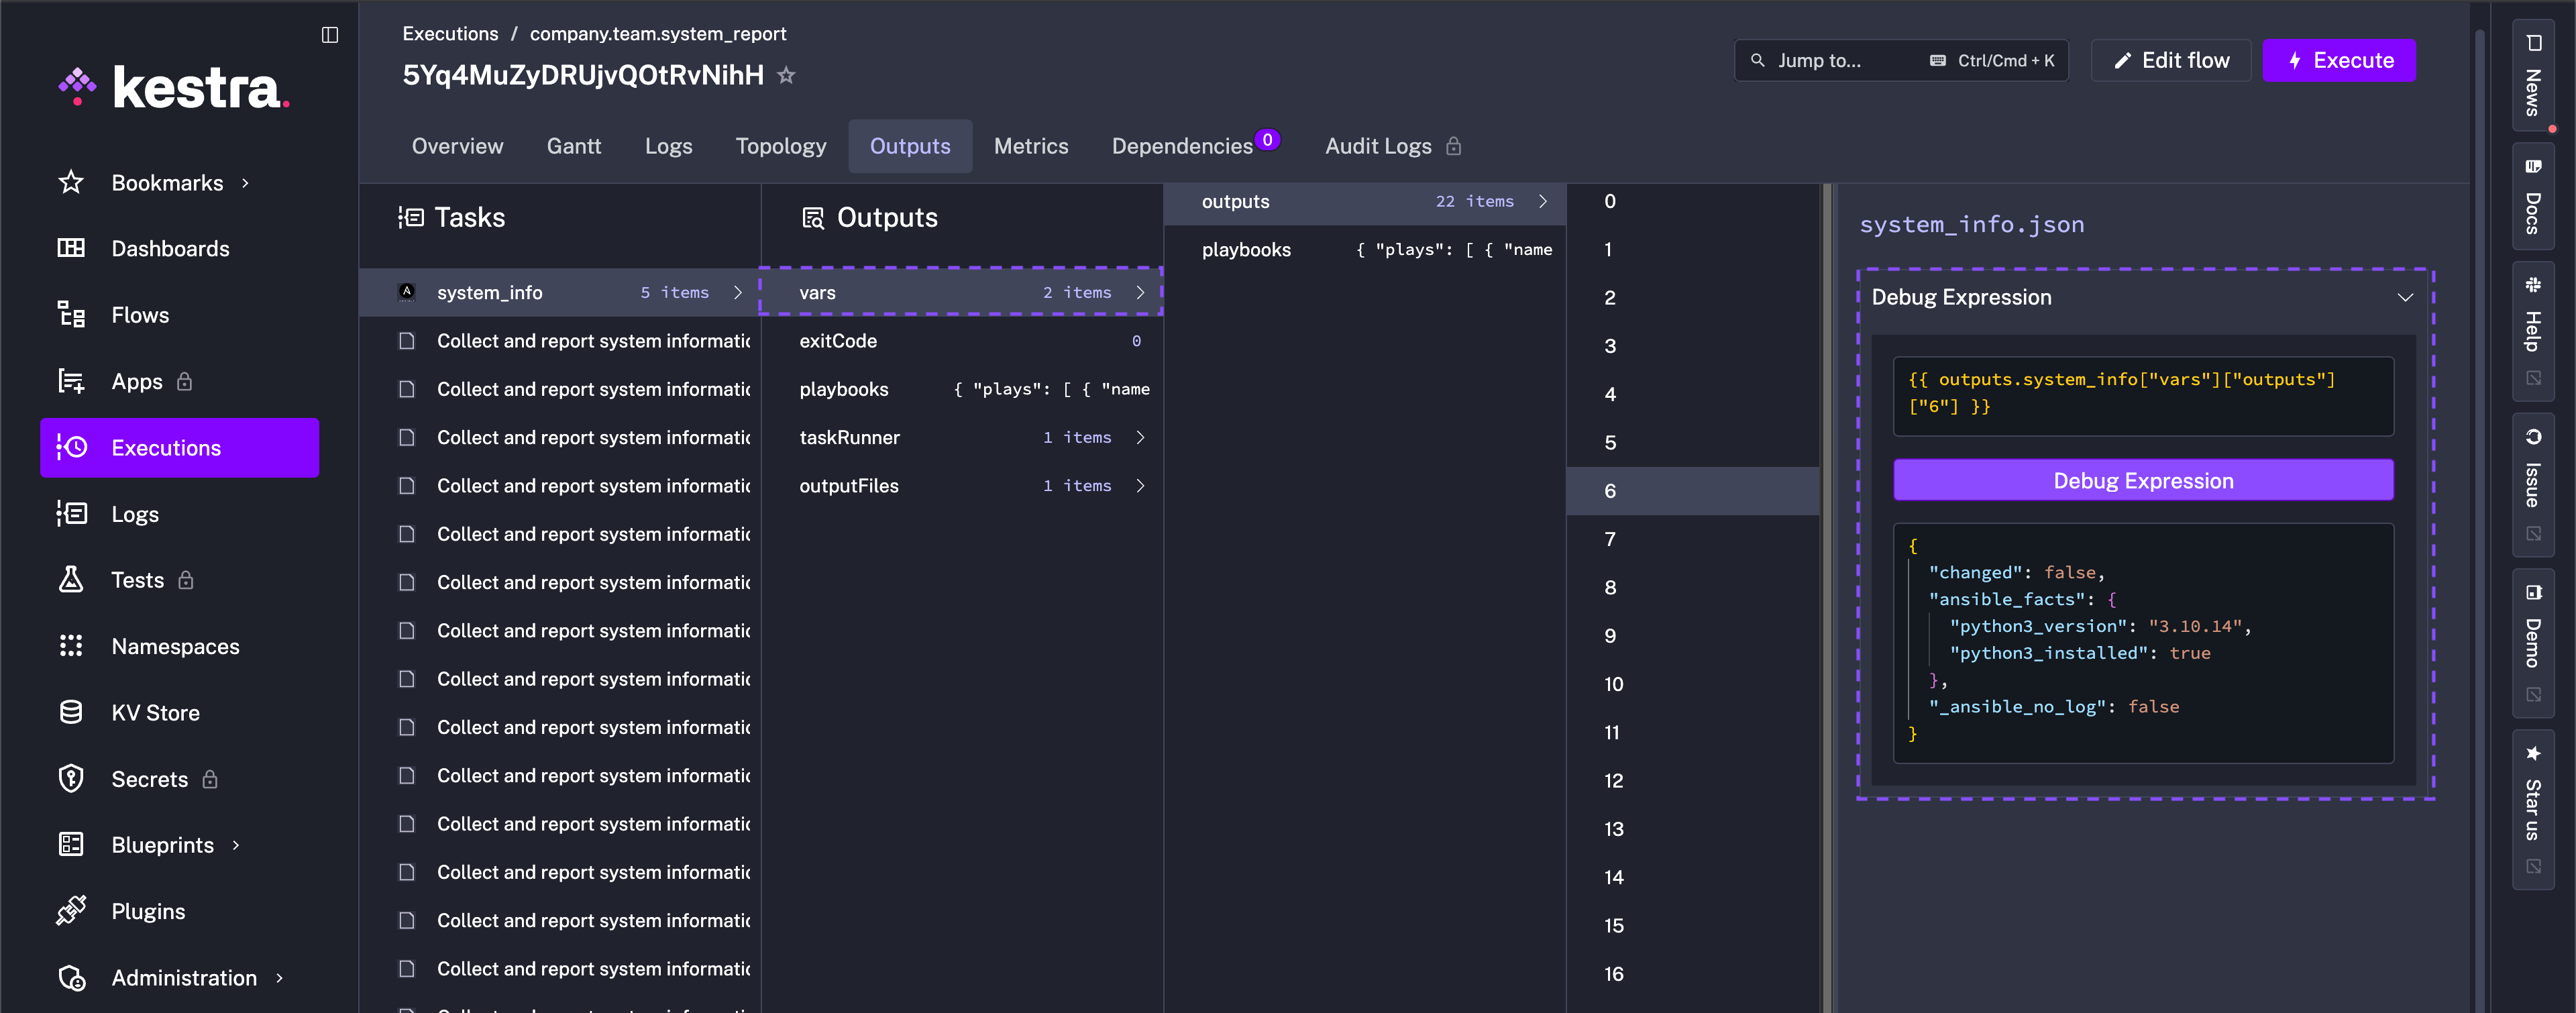
Ansible also reports that "python3_needs_upgrade": true and depending on the detected OS of the machine, upgrades accordingly.
Everything from this Python upgrade to other machine diagnostics are aggregated in system_info.json with mode 0600 so you have a tidy, readable report. This playbook can of course be adapted for other checks and in principle demonstrates the possibilities when you combine Ansible with Kestra.
Run it locally
Ensure Ansible is installed and save the YAML as system_info.yml, run it against localhost, and inspect the output:
ansible-playbook -i localhost, -c local system_info.yml- Optionally inspect the JSON:
jq '.' system_info.json
The diagnostics report captured looks like the following (macOS):
{ "diagnostics": { "disk_usage": [ "Filesystem Size Used Avail Capacity iused ifree %iused Mounted on", "/dev/disk3s1 466Gi 128Gi 318Gi 29% 1453290 4882459910 0% /" ], "uptime": "18:42 up 5 days, 7:31, 4 users, load averages: 2.34 2.11 1.98", "top_mem_processes": [ "USER PID %CPU %MEM VSZ RSS TT STAT STARTED TIME COMMAND", "jdoe 4287 23.5 9.8 9876544 823456 ?? R 9:12PM 0:21.43 /Applications/Chrome", "jdoe 1562 7.3 5.4 6453320 455121 ?? S 7:58AM 12:11.01 /usr/bin/python3 myscript.py", "_windowser 991 3.8 3.8 5432100 315789 ?? S Fri11AM 5:45.22 WindowServer", "root 72 1.2 2.2 4321000 190233 ?? S Sun09AM 3:12.90 /usr/libexec/trustd", "jdoe 2178 0.9 1.6 3876543 131442 ?? S Sat08PM 1:03.07 Slack" ] }}And the machine information outputs the follwing for local macOS machine:
TASK [Show basic system summary] *************************************************************************************************************************************ok: [localhost] => { "msg": [ "Hostname: Mac", "OS: Darwin MacOSX 15.6.1", "Kernel: 24.6.0", "Architecture: arm64", "CPU(s): 10", "Total RAM (MB): 24576", "Primary IP: 10.0.0.42" ]}Run it from Kestra
Embed the playbook in your flow’s YAML inline, and collect the report with a single Ansible CLI task:
id: system_reportnamespace: company.team
tasks:  - id: system_info    type: io.kestra.plugin.ansible.cli.AnsibleCLI    inputFiles:      playbook.yml: |        # paste the playbook above      inventory.ini: |        localhost ansible_connection=local    outputFiles:      - system_info.json    containerImage: cytopia/ansible:latest-tools    commands:      - ansible-playbook -i inventory.ini playbook.yml
Or, keep the playbook as a Namespace File and reference it directly with the same Ansible CLI task.
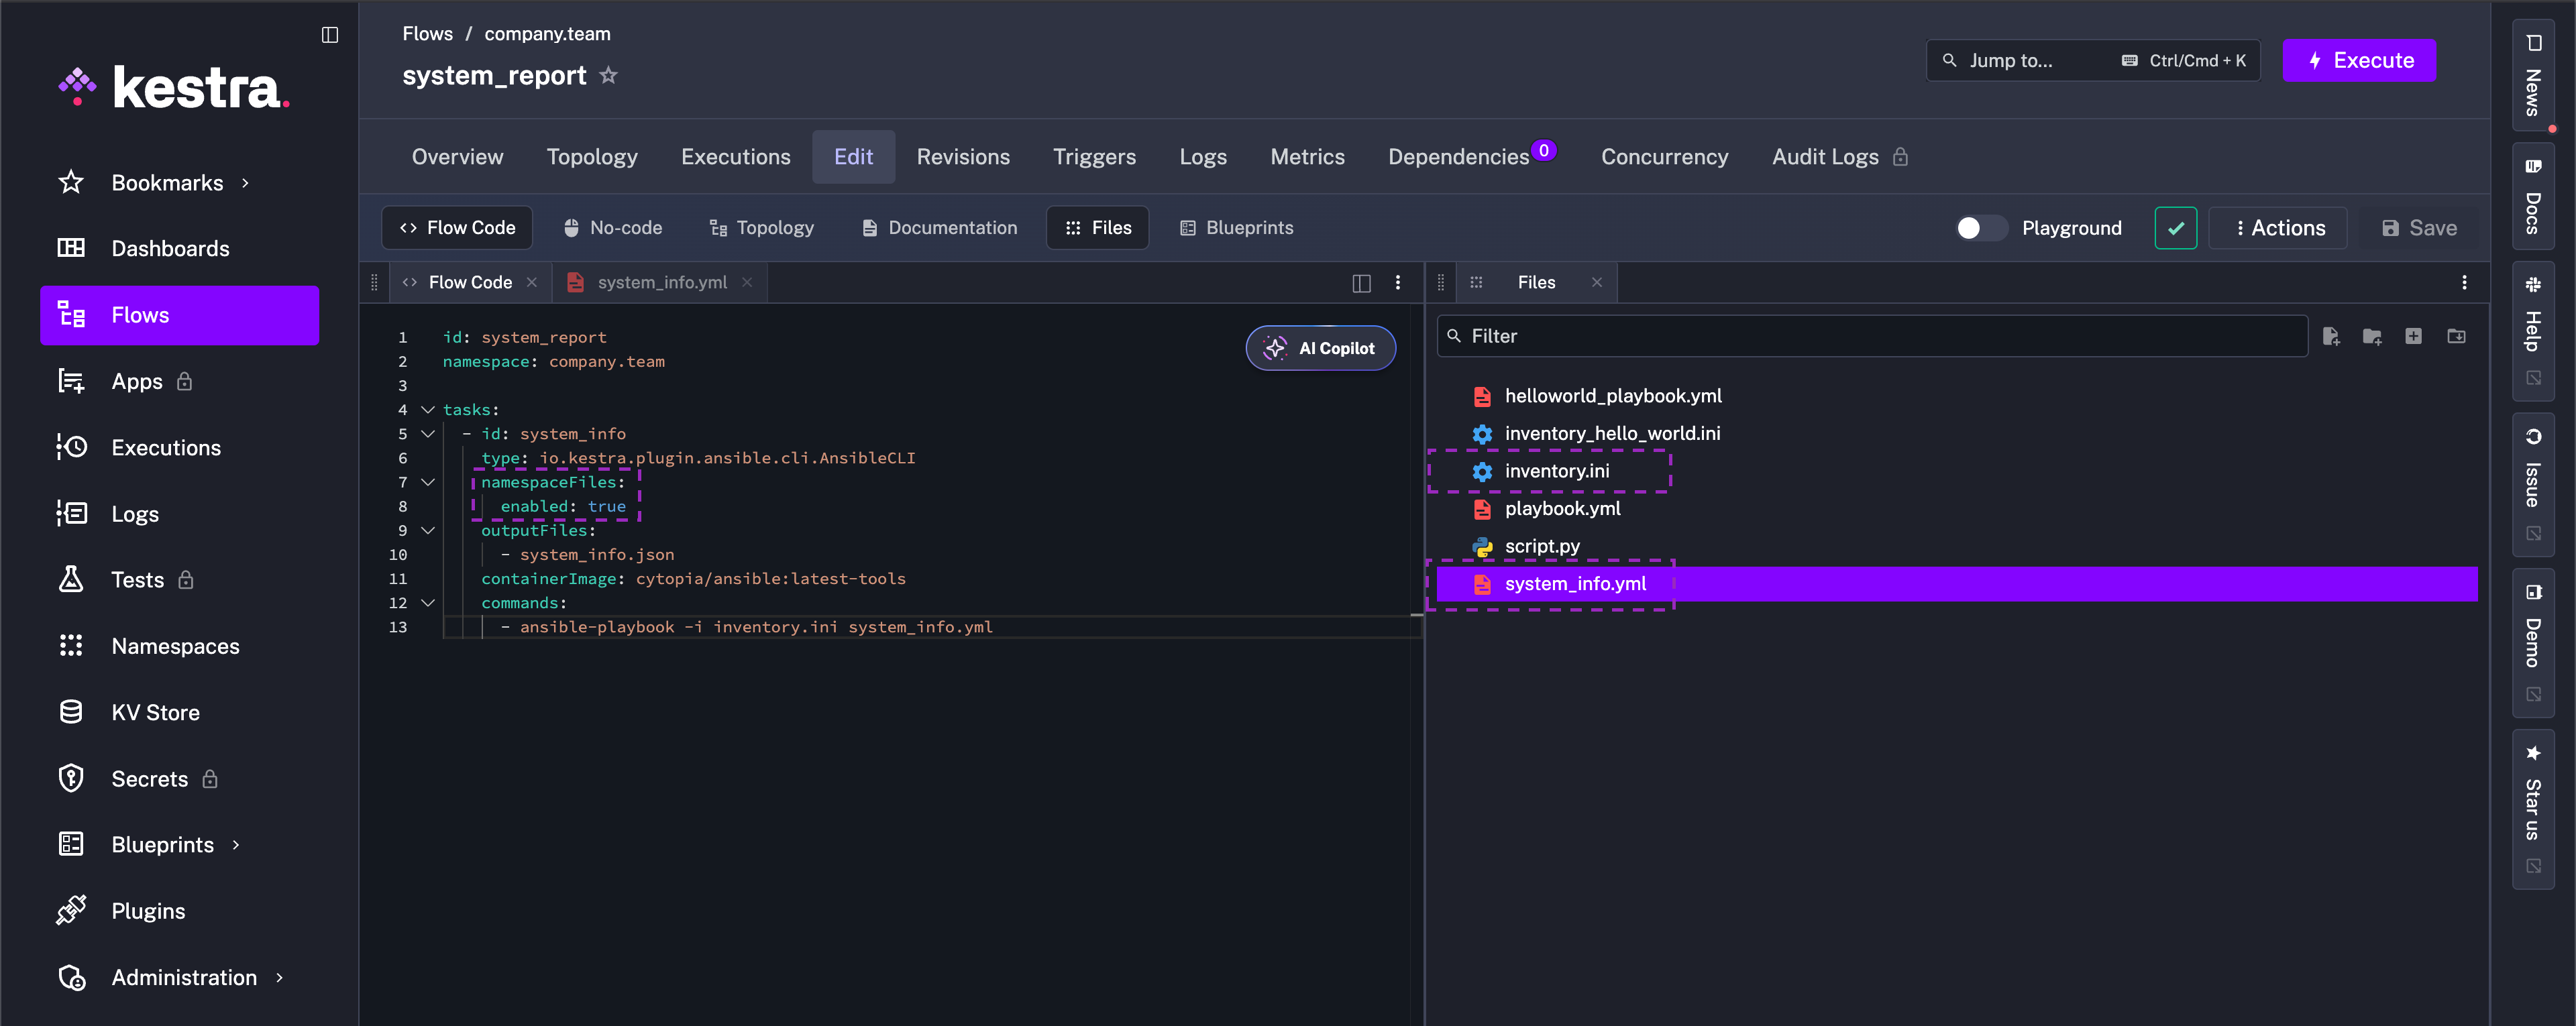
Also add the inventory.ini file to the Namespace (localhost ansible_connection=local). For simplicity, this guide checks the local machine, but of course this example can be expanded to utilize Ansible’s capability to SSH into multiple servers and perform operations:
id: system_reportnamespace: company.team
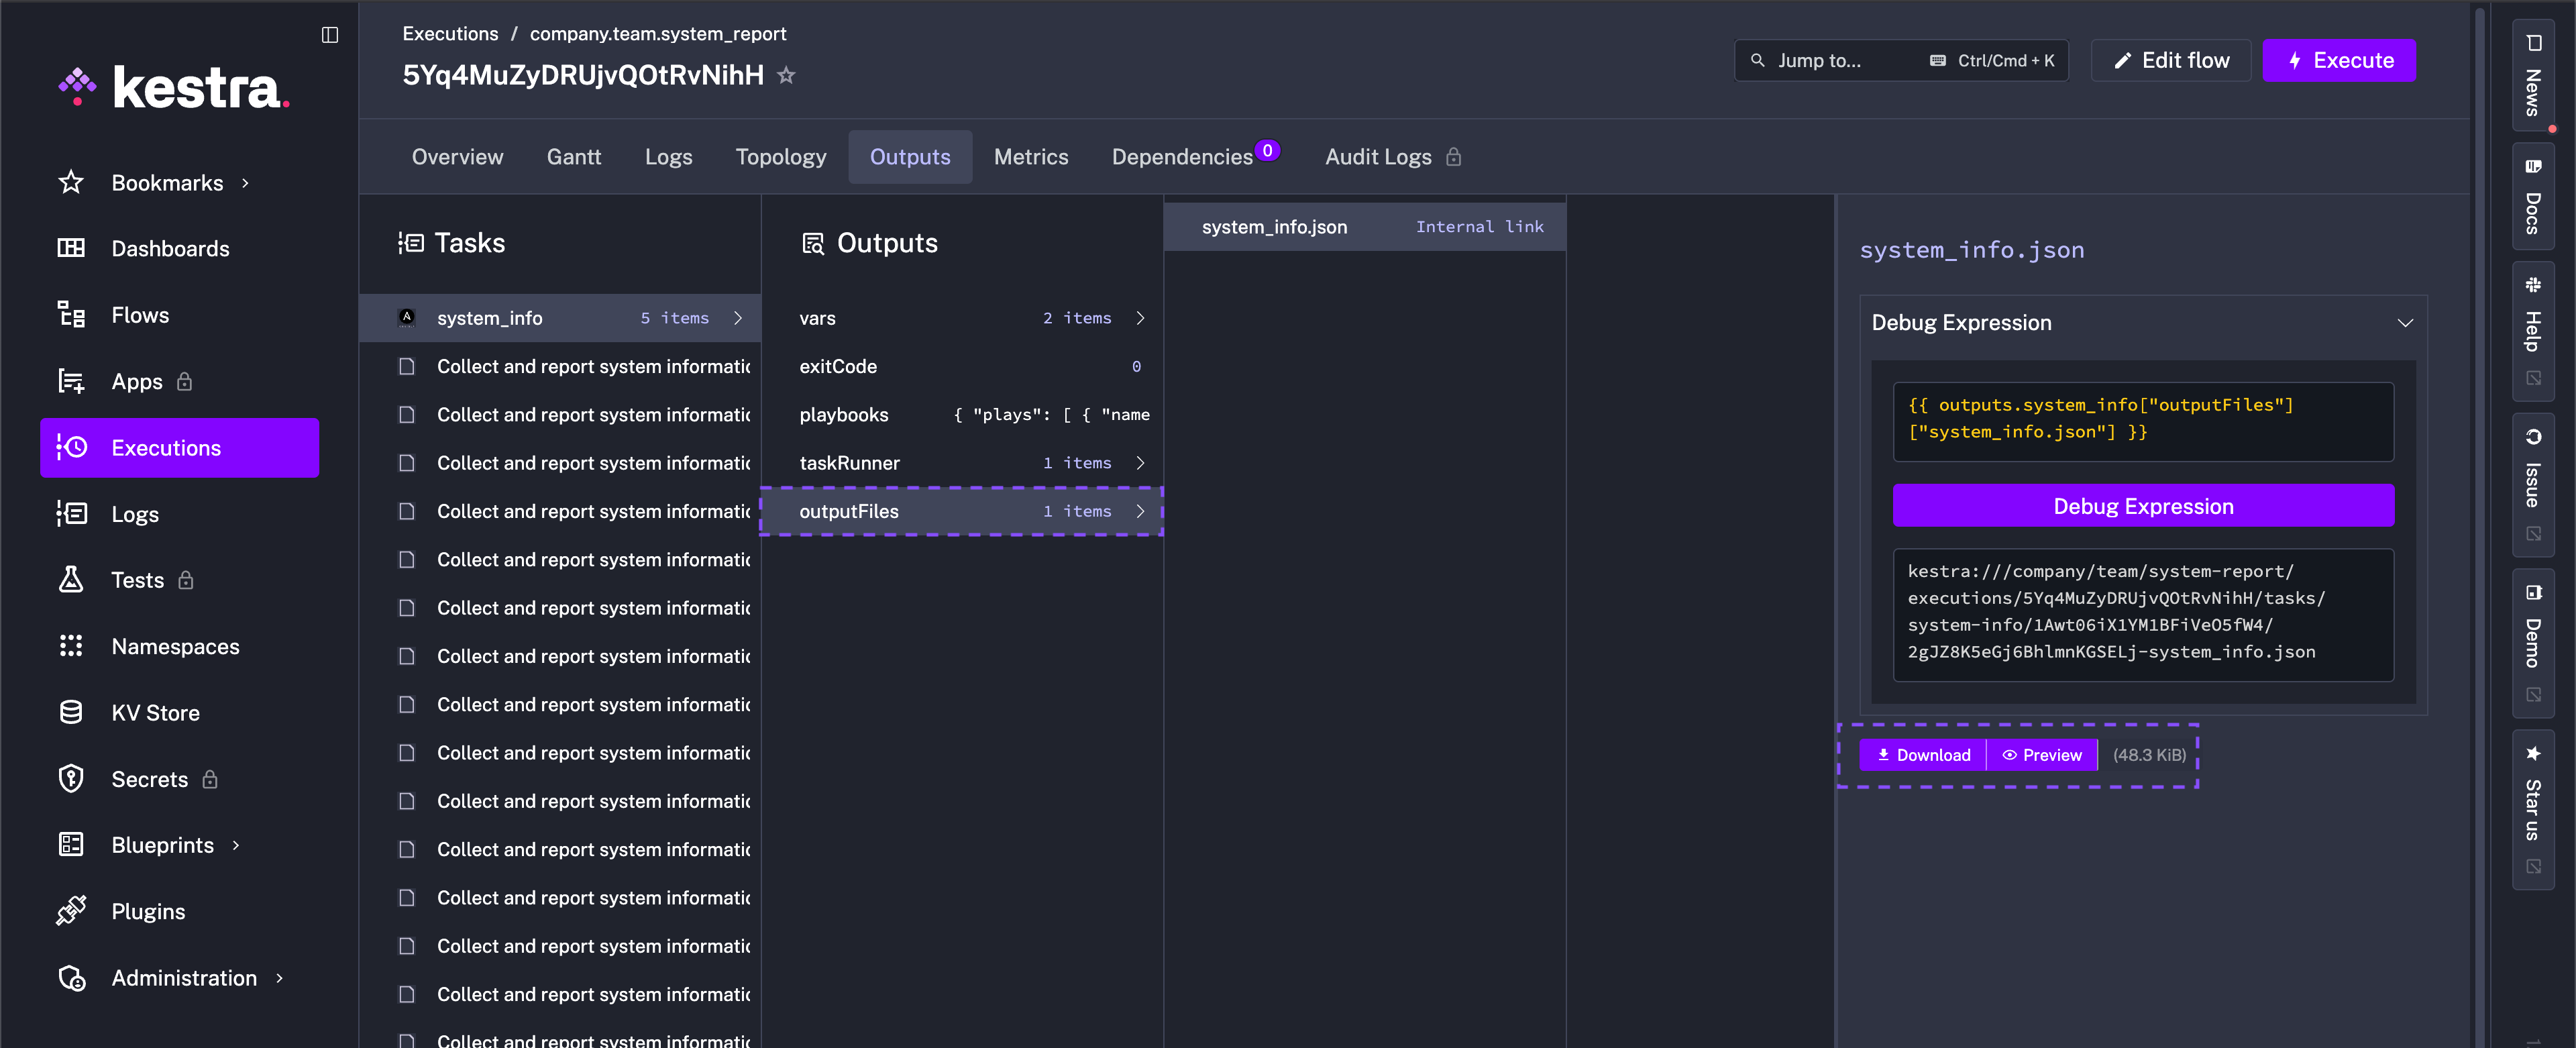
tasks: - id: system_info type: io.kestra.plugin.ansible.cli.AnsibleCLI namespaceFiles: enabled: true outputFiles: - system_info.json containerImage: cytopia/ansible:latest-tools commands: - ansible-playbook -i inventory.ini system_info.ymlAfter the run, the outputFiles property allows you to preview or download system_info.json from the task outputs and feed it into downstream checks or dashboards.
Upload the report to S3
Extend the Namespace File flow with an S3 Upload task and store credentials in secrets:
id: system_report_to_s3namespace: company.team
tasks:  - id: system_info    type: io.kestra.plugin.ansible.cli.AnsibleCLI    namespaceFiles:      enabled: true    outputFiles:      - system_info.json    containerImage: cytopia/ansible:latest-tools    commands:      - ansible-playbook -i inventory.ini system_info.yml
  - id: upload_output_to_s3    type: io.kestra.plugin.aws.s3.Upload    region: "{{ secret('AWS_DEFAULT_REGION') }}"    accessKeyId: "{{ secret('AWS_ACCESS_KEY_ID') }}"    secretKeyId: "{{ secret('AWS_SECRET_KEY_ID') }}"    bucket: "{{ secret('S3_BUCKET_NAME') }}"    key: "system_reports/{{ execution.id }}/system_info.json"    from: "{{ outputs.system_info.outputFiles['system_info.json'] }}"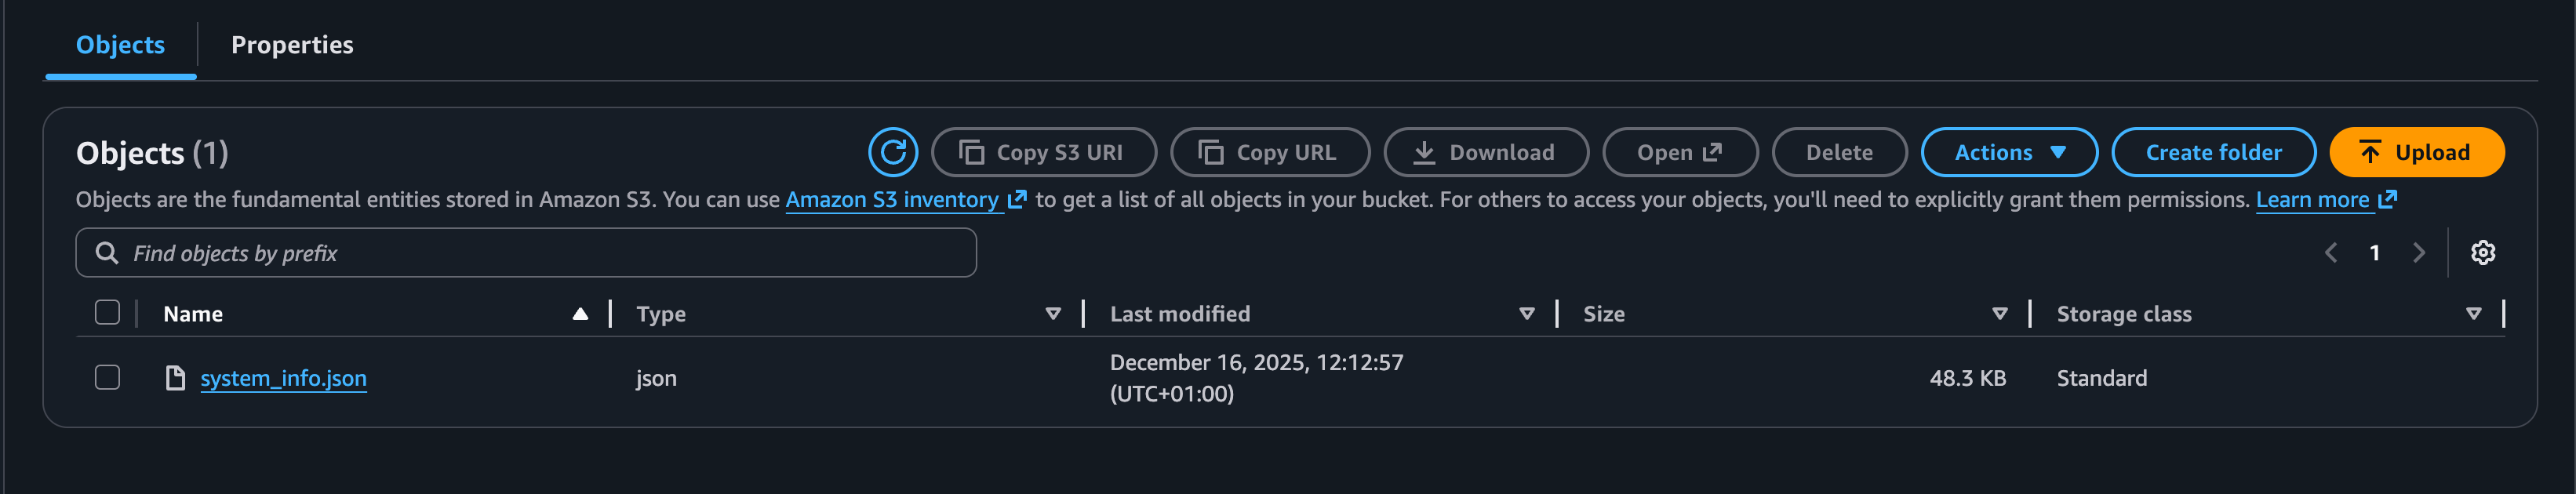
The upload_output_to_s3 task pushes the generated JSON to S3 using secrets for credentials and bucket name; reuse outputFiles expressions anywhere you need the file.
Add a Slack notification
To include a separate notification to the relevant channels, add the Slack Incoming Webhook task after the upload with a message alerting that “Machine X” had outdated software and patched an upgrade. You can swap Slack for any other notifier in the Plugin catalog or chain multiple notifications if needed:
- id: slack_notification type: io.kestra.plugin.slack.notifications.SlackIncomingWebhook url: "{{ secret('SLACK_WEBHOOK_URL') }}" messageText: "Machine `{{ flow.id }}` had outdated Python and an upgrade took place during execution `{{ execution.id }}`. Report available at S3: `{{ outputs.upload_output_to_s3.key }}`"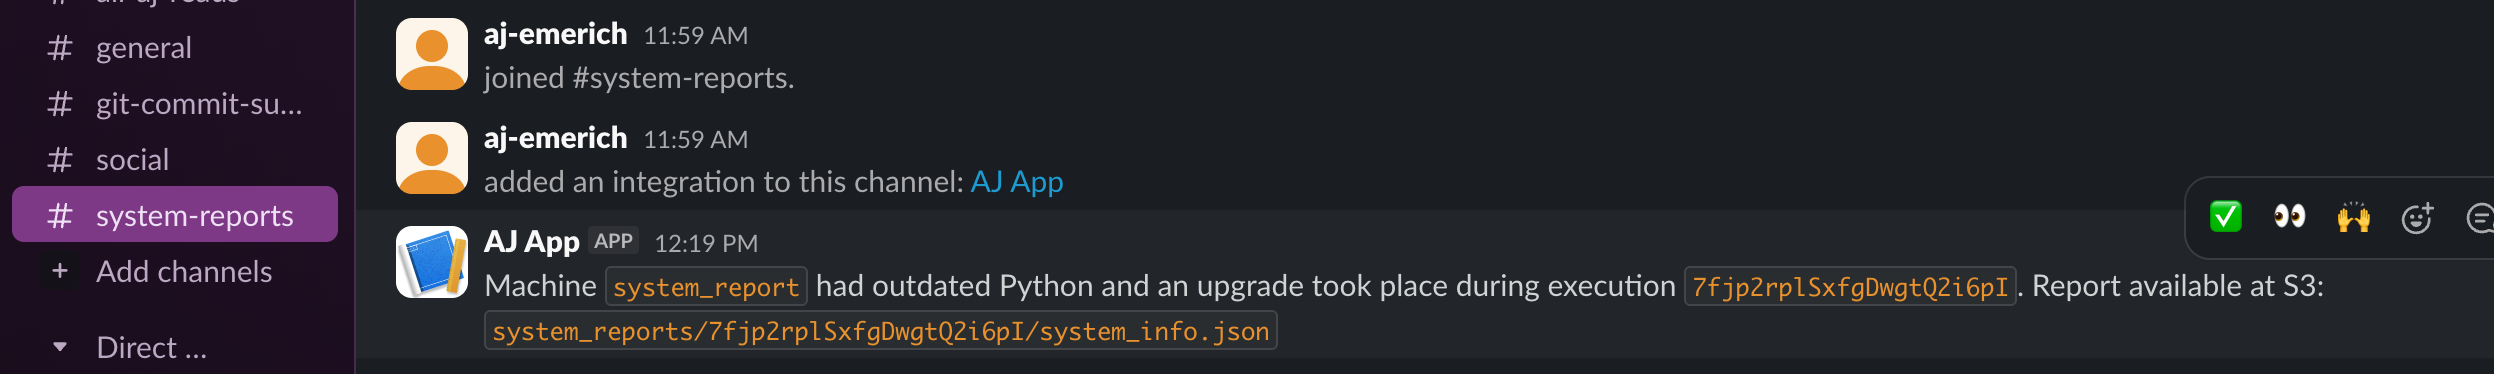
Trigger it (scheduled or event-driven)
Lastly, add a trigger so the flow runs automatically — either on a schedule (Schedule trigger) or from an external event (Webhook trigger):
triggers:  - id: nightly_audit    type: io.kestra.plugin.core.trigger.Schedule    cron: "0 2 * * *"   # every night at 2 AM
  # Or, event-driven example (e.g., HTTP webhook from your MDM/ITSM):  # - id: mdm_webhook  #   type: io.kestra.plugin.core.http.Webhook
A trigger allows you to build a historical log of machine health in S3 and Slack without manual runs.
Wrap up
Ansible handles host-level automation — collecting facts, checking software package versions, remediating with the right package manager, and so much more. Kestra now orchestrates the run, stores secrets, uploads the JSON report to S3, and notifies Slack (or your preferred channel) so teams see when upgrades occur. Together they scale this cross-platform playbook from one laptop to a fleet, with repeatable runs and downstream integrations ready to consume the results.
If your playbooks handle credentials or other sensitive data, see Control Ansible Playbook Outputs to Protect Sensitive Data for how to use outputsMode: EXPLICIT to control exactly which values appear in Kestra task outputs.
Was this page helpful?